Inupiat vs Hmong Male Unemployment
COMPARE
Inupiat
Hmong
Male Unemployment
Male Unemployment Comparison
Inupiat
Hmong
12.1%
MALE UNEMPLOYMENT
0.0/ 100
METRIC RATING
346th/ 347
METRIC RANK
5.5%
MALE UNEMPLOYMENT
7.0/ 100
METRIC RATING
212th/ 347
METRIC RANK
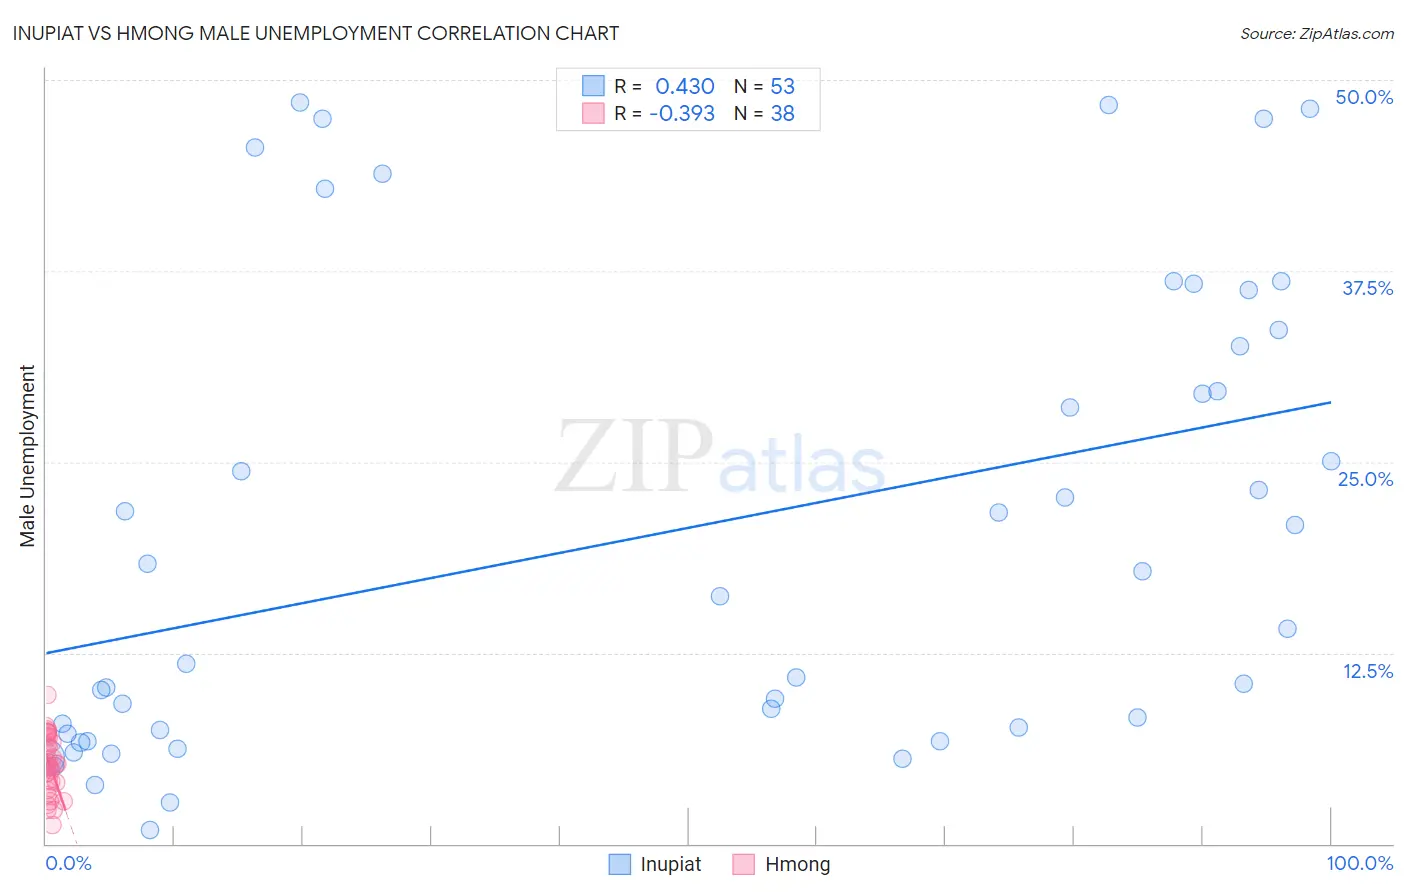
Inupiat vs Hmong Male Unemployment Correlation Chart
The statistical analysis conducted on geographies consisting of 96,169,254 people shows a moderate positive correlation between the proportion of Inupiat and unemployment rate among males in the United States with a correlation coefficient (R) of 0.430 and weighted average of 12.1%. Similarly, the statistical analysis conducted on geographies consisting of 24,680,008 people shows a mild negative correlation between the proportion of Hmong and unemployment rate among males in the United States with a correlation coefficient (R) of -0.393 and weighted average of 5.5%, a difference of 119.8%.
Male Unemployment Correlation Summary
| Measurement | Inupiat | Hmong |
| Minimum | 0.90% | 1.2% |
| Maximum | 48.5% | 9.8% |
| Range | 47.6% | 8.6% |
| Mean | 20.4% | 5.2% |
| Median | 16.2% | 5.2% |
| Interquartile 25% (IQ1) | 7.3% | 4.0% |
| Interquartile 75% (IQ3) | 33.1% | 7.0% |
| Interquartile Range (IQR) | 25.8% | 3.0% |
| Standard Deviation (Sample) | 15.0% | 1.9% |
| Standard Deviation (Population) | 14.9% | 1.9% |
Similar Demographics by Male Unemployment
Demographics Similar to Inupiat by Male Unemployment
In terms of male unemployment, the demographic groups most similar to Inupiat are Arapaho (11.0%, a difference of 9.8%), Hopi (10.8%, a difference of 12.0%), Crow (10.6%, a difference of 13.8%), Tohono O'odham (10.2%, a difference of 18.8%), and Navajo (9.8%, a difference of 22.9%).
| Demographics | Rating | Rank | Male Unemployment |
| Sioux | 0.0 /100 | #333 | Tragic 8.4% |
| Tsimshian | 0.0 /100 | #334 | Tragic 8.5% |
| Pueblo | 0.0 /100 | #335 | Tragic 8.5% |
| Yuman | 0.0 /100 | #336 | Tragic 8.6% |
| Puerto Ricans | 0.0 /100 | #337 | Tragic 8.6% |
| Apache | 0.0 /100 | #338 | Tragic 8.6% |
| Cheyenne | 0.0 /100 | #339 | Tragic 9.8% |
| Alaskan Athabascans | 0.0 /100 | #340 | Tragic 9.8% |
| Navajo | 0.0 /100 | #341 | Tragic 9.8% |
| Tohono O'odham | 0.0 /100 | #342 | Tragic 10.2% |
| Crow | 0.0 /100 | #343 | Tragic 10.6% |
| Hopi | 0.0 /100 | #344 | Tragic 10.8% |
| Arapaho | 0.0 /100 | #345 | Tragic 11.0% |
| Inupiat | 0.0 /100 | #346 | Tragic 12.1% |
| Yup'ik | 0.0 /100 | #347 | Tragic 16.4% |
Demographics Similar to Hmong by Male Unemployment
In terms of male unemployment, the demographic groups most similar to Hmong are Israeli (5.5%, a difference of 0.090%), South American Indian (5.5%, a difference of 0.14%), Ugandan (5.5%, a difference of 0.16%), Immigrants from Middle Africa (5.5%, a difference of 0.27%), and Immigrants from Lebanon (5.5%, a difference of 0.32%).
| Demographics | Rating | Rank | Male Unemployment |
| Immigrants | Costa Rica | 11.4 /100 | #205 | Poor 5.5% |
| Immigrants | Ukraine | 9.9 /100 | #206 | Tragic 5.5% |
| Immigrants | Syria | 9.3 /100 | #207 | Tragic 5.5% |
| Immigrants | Lebanon | 8.6 /100 | #208 | Tragic 5.5% |
| Immigrants | Middle Africa | 8.3 /100 | #209 | Tragic 5.5% |
| South American Indians | 7.6 /100 | #210 | Tragic 5.5% |
| Israelis | 7.4 /100 | #211 | Tragic 5.5% |
| Hmong | 7.0 /100 | #212 | Tragic 5.5% |
| Ugandans | 6.3 /100 | #213 | Tragic 5.5% |
| Puget Sound Salish | 5.6 /100 | #214 | Tragic 5.5% |
| Samoans | 4.9 /100 | #215 | Tragic 5.5% |
| Immigrants | Immigrants | 4.3 /100 | #216 | Tragic 5.5% |
| Delaware | 4.2 /100 | #217 | Tragic 5.5% |
| Immigrants | Albania | 3.6 /100 | #218 | Tragic 5.5% |
| Immigrants | Western Asia | 3.5 /100 | #219 | Tragic 5.6% |