Indonesian vs Immigrants from Europe Unemployment Among Ages 25 to 29 years
COMPARE
Indonesian
Immigrants from Europe
Unemployment Among Ages 25 to 29 years
Unemployment Among Ages 25 to 29 years Comparison
Indonesians
Immigrants from Europe
6.1%
UNEMPLOYMENT AMONG AGES 25 TO 29 YEARS
99.3/ 100
METRIC RATING
39th/ 347
METRIC RANK
6.5%
UNEMPLOYMENT AMONG AGES 25 TO 29 YEARS
75.7/ 100
METRIC RATING
133rd/ 347
METRIC RANK
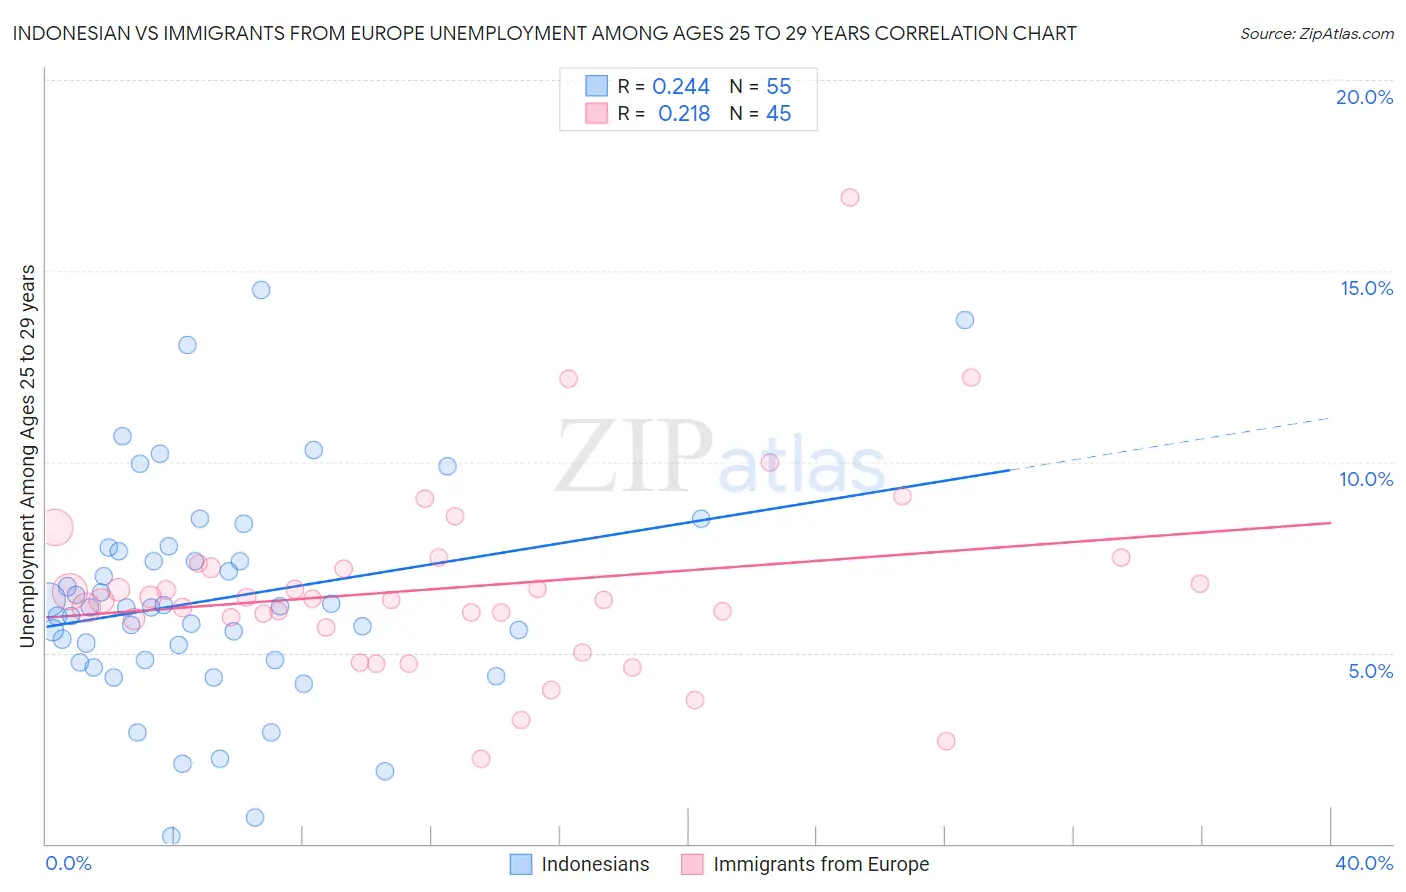
Indonesian vs Immigrants from Europe Unemployment Among Ages 25 to 29 years Correlation Chart
The statistical analysis conducted on geographies consisting of 160,246,641 people shows a weak positive correlation between the proportion of Indonesians and unemployment rate among population between the ages 25 and 29 in the United States with a correlation coefficient (R) of 0.244 and weighted average of 6.1%. Similarly, the statistical analysis conducted on geographies consisting of 495,238,580 people shows a weak positive correlation between the proportion of Immigrants from Europe and unemployment rate among population between the ages 25 and 29 in the United States with a correlation coefficient (R) of 0.218 and weighted average of 6.5%, a difference of 6.5%.
Unemployment Among Ages 25 to 29 years Correlation Summary
| Measurement | Indonesian | Immigrants from Europe |
| Minimum | 0.20% | 2.2% |
| Maximum | 14.5% | 16.9% |
| Range | 14.3% | 14.7% |
| Mean | 6.4% | 6.7% |
| Median | 6.2% | 6.4% |
| Interquartile 25% (IQ1) | 4.8% | 5.8% |
| Interquartile 75% (IQ3) | 7.6% | 7.3% |
| Interquartile Range (IQR) | 2.8% | 1.5% |
| Standard Deviation (Sample) | 2.9% | 2.5% |
| Standard Deviation (Population) | 2.8% | 2.5% |
Similar Demographics by Unemployment Among Ages 25 to 29 years
Demographics Similar to Indonesians by Unemployment Among Ages 25 to 29 years
In terms of unemployment among ages 25 to 29 years, the demographic groups most similar to Indonesians are Immigrants from Kenya (6.1%, a difference of 0.13%), Fijian (6.1%, a difference of 0.17%), Ethiopian (6.1%, a difference of 0.20%), Jordanian (6.1%, a difference of 0.20%), and Immigrants from Serbia (6.1%, a difference of 0.33%).
| Demographics | Rating | Rank | Unemployment Among Ages 25 to 29 years |
| Chinese | 99.6 /100 | #32 | Exceptional 6.1% |
| Yugoslavians | 99.6 /100 | #33 | Exceptional 6.1% |
| Immigrants | Morocco | 99.5 /100 | #34 | Exceptional 6.1% |
| Immigrants | Zimbabwe | 99.5 /100 | #35 | Exceptional 6.1% |
| Taiwanese | 99.5 /100 | #36 | Exceptional 6.1% |
| Immigrants | Serbia | 99.5 /100 | #37 | Exceptional 6.1% |
| Ethiopians | 99.4 /100 | #38 | Exceptional 6.1% |
| Indonesians | 99.3 /100 | #39 | Exceptional 6.1% |
| Immigrants | Kenya | 99.3 /100 | #40 | Exceptional 6.1% |
| Fijians | 99.3 /100 | #41 | Exceptional 6.1% |
| Jordanians | 99.3 /100 | #42 | Exceptional 6.1% |
| Czechs | 99.2 /100 | #43 | Exceptional 6.2% |
| Mongolians | 99.2 /100 | #44 | Exceptional 6.2% |
| Venezuelans | 99.1 /100 | #45 | Exceptional 6.2% |
| Immigrants | Lithuania | 99.0 /100 | #46 | Exceptional 6.2% |
Demographics Similar to Immigrants from Europe by Unemployment Among Ages 25 to 29 years
In terms of unemployment among ages 25 to 29 years, the demographic groups most similar to Immigrants from Europe are Immigrants from Vietnam (6.5%, a difference of 0.010%), Immigrants from Croatia (6.5%, a difference of 0.010%), Northern European (6.5%, a difference of 0.030%), Polish (6.5%, a difference of 0.080%), and Eastern European (6.5%, a difference of 0.14%).
| Demographics | Rating | Rank | Unemployment Among Ages 25 to 29 years |
| Brazilians | 81.9 /100 | #126 | Excellent 6.5% |
| Dutch | 80.6 /100 | #127 | Excellent 6.5% |
| Immigrants | Chile | 80.5 /100 | #128 | Excellent 6.5% |
| Sri Lankans | 80.3 /100 | #129 | Excellent 6.5% |
| Immigrants | Peru | 79.9 /100 | #130 | Good 6.5% |
| Immigrants | Afghanistan | 79.2 /100 | #131 | Good 6.5% |
| Poles | 76.6 /100 | #132 | Good 6.5% |
| Immigrants | Europe | 75.7 /100 | #133 | Good 6.5% |
| Immigrants | Vietnam | 75.6 /100 | #134 | Good 6.5% |
| Immigrants | Croatia | 75.5 /100 | #135 | Good 6.5% |
| Northern Europeans | 75.4 /100 | #136 | Good 6.5% |
| Eastern Europeans | 74.1 /100 | #137 | Good 6.5% |
| Immigrants | Belgium | 73.8 /100 | #138 | Good 6.5% |
| Austrians | 73.8 /100 | #139 | Good 6.5% |
| Immigrants | Pakistan | 73.8 /100 | #140 | Good 6.5% |