Indonesian vs Immigrants from Europe 3rd Grade
COMPARE
Indonesian
Immigrants from Europe
3rd Grade
3rd Grade Comparison
Indonesians
Immigrants from Europe
96.5%
3RD GRADE
0.0/ 100
METRIC RATING
321st/ 347
METRIC RANK
98.0%
3RD GRADE
91.2/ 100
METRIC RATING
130th/ 347
METRIC RANK
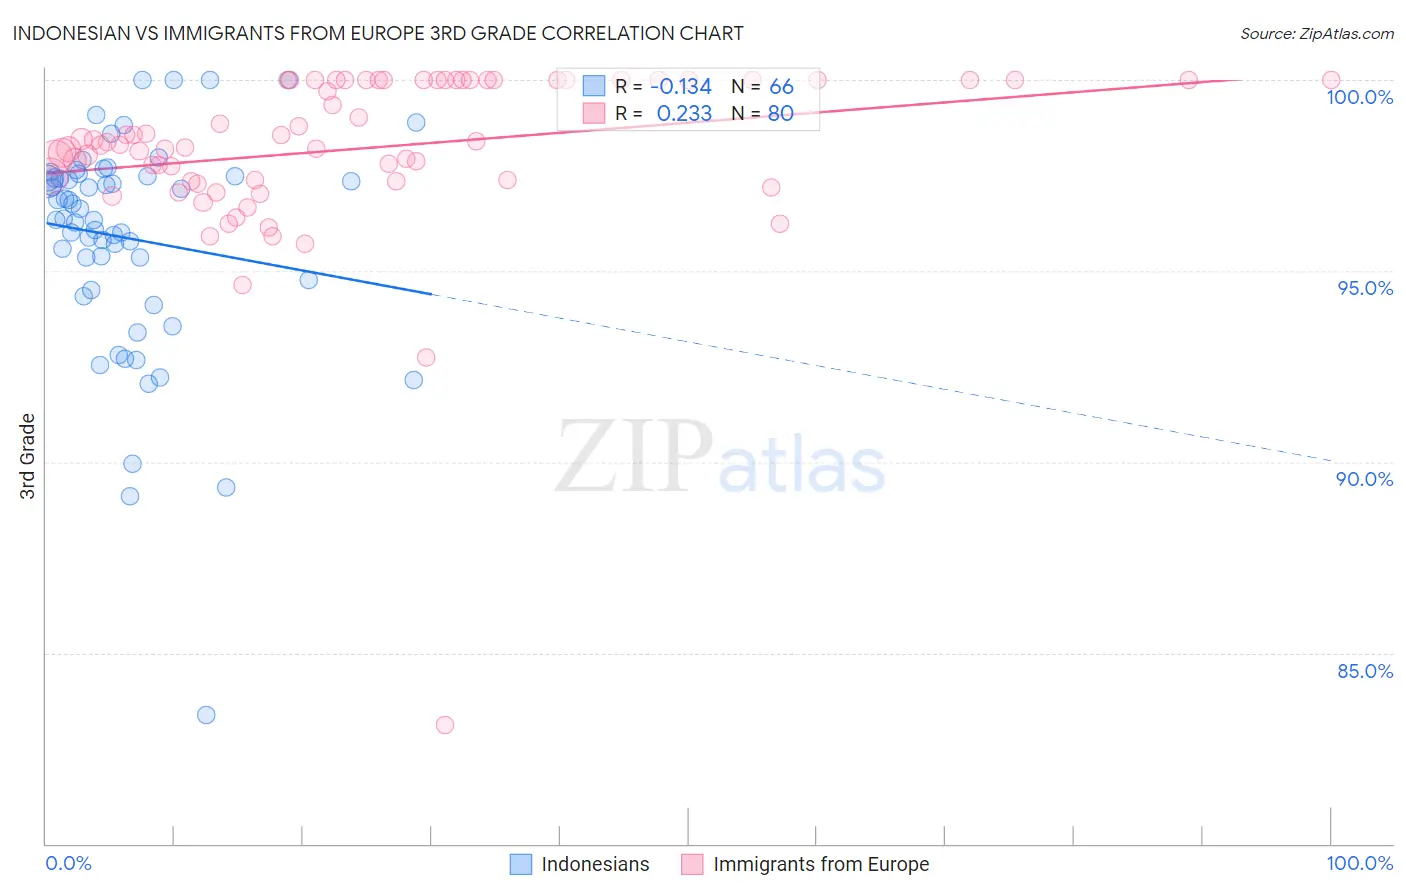
Indonesian vs Immigrants from Europe 3rd Grade Correlation Chart
The statistical analysis conducted on geographies consisting of 162,727,113 people shows a poor negative correlation between the proportion of Indonesians and percentage of population with at least 3rd grade education in the United States with a correlation coefficient (R) of -0.134 and weighted average of 96.5%. Similarly, the statistical analysis conducted on geographies consisting of 547,425,973 people shows a weak positive correlation between the proportion of Immigrants from Europe and percentage of population with at least 3rd grade education in the United States with a correlation coefficient (R) of 0.233 and weighted average of 98.0%, a difference of 1.5%.
3rd Grade Correlation Summary
| Measurement | Indonesian | Immigrants from Europe |
| Minimum | 83.4% | 83.1% |
| Maximum | 100.0% | 100.0% |
| Range | 16.6% | 16.9% |
| Mean | 95.9% | 98.2% |
| Median | 96.5% | 98.3% |
| Interquartile 25% (IQ1) | 94.8% | 97.4% |
| Interquartile 75% (IQ3) | 97.5% | 100.0% |
| Interquartile Range (IQR) | 2.7% | 2.6% |
| Standard Deviation (Sample) | 2.9% | 2.3% |
| Standard Deviation (Population) | 2.9% | 2.3% |
Similar Demographics by 3rd Grade
Demographics Similar to Indonesians by 3rd Grade
In terms of 3rd grade, the demographic groups most similar to Indonesians are Immigrants from Nicaragua (96.5%, a difference of 0.0%), Immigrants from Belize (96.5%, a difference of 0.0%), Vietnamese (96.5%, a difference of 0.010%), Honduran (96.5%, a difference of 0.020%), and Hispanic or Latino (96.5%, a difference of 0.030%).
| Demographics | Rating | Rank | 3rd Grade |
| Belizeans | 0.0 /100 | #314 | Tragic 96.6% |
| Immigrants | Azores | 0.0 /100 | #315 | Tragic 96.6% |
| Immigrants | Burma/Myanmar | 0.0 /100 | #316 | Tragic 96.6% |
| Immigrants | Bangladesh | 0.0 /100 | #317 | Tragic 96.6% |
| Hispanics or Latinos | 0.0 /100 | #318 | Tragic 96.5% |
| Vietnamese | 0.0 /100 | #319 | Tragic 96.5% |
| Immigrants | Nicaragua | 0.0 /100 | #320 | Tragic 96.5% |
| Indonesians | 0.0 /100 | #321 | Tragic 96.5% |
| Immigrants | Belize | 0.0 /100 | #322 | Tragic 96.5% |
| Hondurans | 0.0 /100 | #323 | Tragic 96.5% |
| Dominicans | 0.0 /100 | #324 | Tragic 96.4% |
| Mexican American Indians | 0.0 /100 | #325 | Tragic 96.4% |
| Immigrants | Vietnam | 0.0 /100 | #326 | Tragic 96.4% |
| Japanese | 0.0 /100 | #327 | Tragic 96.4% |
| Bangladeshis | 0.0 /100 | #328 | Tragic 96.3% |
Demographics Similar to Immigrants from Europe by 3rd Grade
In terms of 3rd grade, the demographic groups most similar to Immigrants from Europe are Colville (98.0%, a difference of 0.010%), Immigrants from Serbia (98.0%, a difference of 0.010%), Ute (98.0%, a difference of 0.020%), Immigrants from Bulgaria (97.9%, a difference of 0.020%), and Immigrants from Hungary (97.9%, a difference of 0.020%).
| Demographics | Rating | Rank | 3rd Grade |
| Syrians | 93.8 /100 | #123 | Exceptional 98.0% |
| Immigrants | Japan | 93.7 /100 | #124 | Exceptional 98.0% |
| Immigrants | Saudi Arabia | 93.5 /100 | #125 | Exceptional 98.0% |
| Immigrants | Zimbabwe | 93.4 /100 | #126 | Exceptional 98.0% |
| Ute | 93.2 /100 | #127 | Exceptional 98.0% |
| Colville | 92.1 /100 | #128 | Exceptional 98.0% |
| Immigrants | Serbia | 91.9 /100 | #129 | Exceptional 98.0% |
| Immigrants | Europe | 91.2 /100 | #130 | Exceptional 98.0% |
| Immigrants | Bulgaria | 89.1 /100 | #131 | Excellent 97.9% |
| Immigrants | Hungary | 88.8 /100 | #132 | Excellent 97.9% |
| Immigrants | Kuwait | 88.7 /100 | #133 | Excellent 97.9% |
| Seminole | 88.7 /100 | #134 | Excellent 97.9% |
| Cambodians | 88.1 /100 | #135 | Excellent 97.9% |
| Spaniards | 87.9 /100 | #136 | Excellent 97.9% |
| Immigrants | Romania | 87.9 /100 | #137 | Excellent 97.9% |