Indonesian vs Immigrants from Congo Unemployment Among Ages 20 to 24 years
COMPARE
Indonesian
Immigrants from Congo
Unemployment Among Ages 20 to 24 years
Unemployment Among Ages 20 to 24 years Comparison
Indonesians
Immigrants from Congo
9.0%
UNEMPLOYMENT AMONG AGES 20 TO 24 YEARS
100.0/ 100
METRIC RATING
3rd/ 347
METRIC RANK
9.2%
UNEMPLOYMENT AMONG AGES 20 TO 24 YEARS
100.0/ 100
METRIC RATING
13th/ 347
METRIC RANK
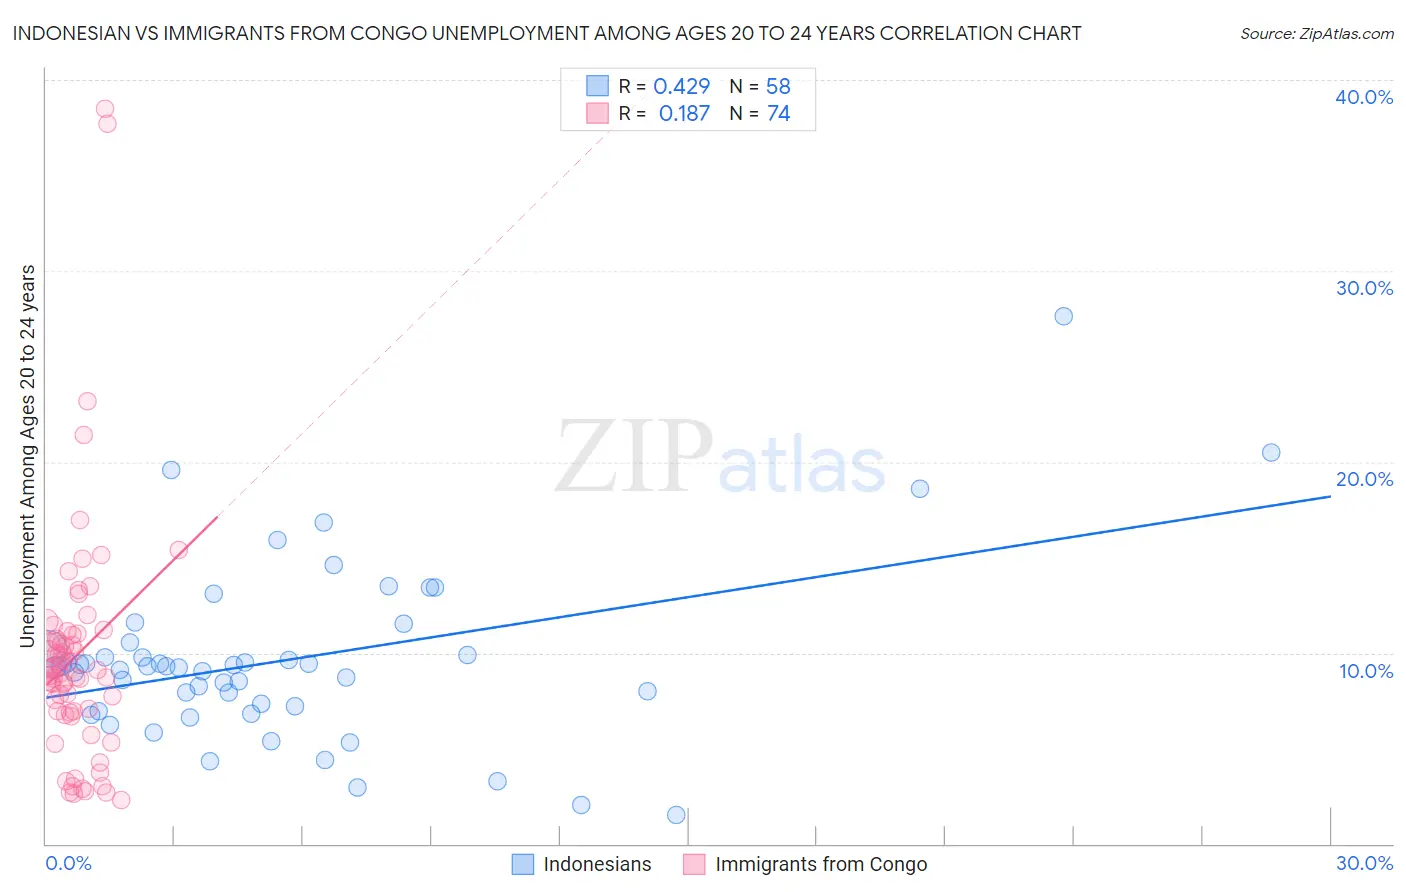
Indonesian vs Immigrants from Congo Unemployment Among Ages 20 to 24 years Correlation Chart
The statistical analysis conducted on geographies consisting of 161,202,926 people shows a moderate positive correlation between the proportion of Indonesians and unemployment rate among population between the ages 20 and 24 in the United States with a correlation coefficient (R) of 0.429 and weighted average of 9.0%. Similarly, the statistical analysis conducted on geographies consisting of 91,573,819 people shows a poor positive correlation between the proportion of Immigrants from Congo and unemployment rate among population between the ages 20 and 24 in the United States with a correlation coefficient (R) of 0.187 and weighted average of 9.2%, a difference of 2.6%.
Unemployment Among Ages 20 to 24 years Correlation Summary
| Measurement | Indonesian | Immigrants from Congo |
| Minimum | 1.5% | 2.3% |
| Maximum | 27.6% | 38.5% |
| Range | 26.1% | 36.2% |
| Mean | 9.6% | 9.8% |
| Median | 9.2% | 9.1% |
| Interquartile 25% (IQ1) | 7.2% | 6.9% |
| Interquartile 75% (IQ3) | 10.2% | 11.0% |
| Interquartile Range (IQR) | 3.0% | 4.0% |
| Standard Deviation (Sample) | 4.6% | 6.2% |
| Standard Deviation (Population) | 4.5% | 6.2% |
Demographics Similar to Indonesians and Immigrants from Congo by Unemployment Among Ages 20 to 24 years
In terms of unemployment among ages 20 to 24 years, the demographic groups most similar to Indonesians are Venezuelan (9.0%, a difference of 0.21%), Norwegian (9.0%, a difference of 0.43%), Immigrants from Venezuela (8.9%, a difference of 1.0%), Immigrants from Burma/Myanmar (9.1%, a difference of 1.0%), and Luxembourger (9.1%, a difference of 1.4%). Similarly, the demographic groups most similar to Immigrants from Congo are Cuban (9.2%, a difference of 0.080%), Zimbabwean (9.2%, a difference of 0.18%), Slovene (9.3%, a difference of 0.38%), Immigrants from Sudan (9.3%, a difference of 0.41%), and Danish (9.3%, a difference of 0.57%).
| Demographics | Rating | Rank | Unemployment Among Ages 20 to 24 years |
| Immigrants | Cuba | 100.0 /100 | #1 | Exceptional 8.7% |
| Immigrants | Venezuela | 100.0 /100 | #2 | Exceptional 8.9% |
| Indonesians | 100.0 /100 | #3 | Exceptional 9.0% |
| Venezuelans | 100.0 /100 | #4 | Exceptional 9.0% |
| Norwegians | 100.0 /100 | #5 | Exceptional 9.0% |
| Immigrants | Burma/Myanmar | 100.0 /100 | #6 | Exceptional 9.1% |
| Luxembourgers | 100.0 /100 | #7 | Exceptional 9.1% |
| Somalis | 100.0 /100 | #8 | Exceptional 9.1% |
| Immigrants | Somalia | 100.0 /100 | #9 | Exceptional 9.2% |
| Sudanese | 100.0 /100 | #10 | Exceptional 9.2% |
| Zimbabweans | 100.0 /100 | #11 | Exceptional 9.2% |
| Cubans | 100.0 /100 | #12 | Exceptional 9.2% |
| Immigrants | Congo | 100.0 /100 | #13 | Exceptional 9.2% |
| Slovenes | 100.0 /100 | #14 | Exceptional 9.3% |
| Immigrants | Sudan | 100.0 /100 | #15 | Exceptional 9.3% |
| Danes | 100.0 /100 | #16 | Exceptional 9.3% |
| Czechs | 100.0 /100 | #17 | Exceptional 9.3% |
| Chinese | 100.0 /100 | #18 | Exceptional 9.4% |
| Hmong | 100.0 /100 | #19 | Exceptional 9.4% |
| Osage | 100.0 /100 | #20 | Exceptional 9.4% |