Indian (Asian) vs Immigrants from Northern Africa Unemployment Among Ages 45 to 54 years
COMPARE
Indian (Asian)
Immigrants from Northern Africa
Unemployment Among Ages 45 to 54 years
Unemployment Among Ages 45 to 54 years Comparison
Indians (Asian)
Immigrants from Northern Africa
4.5%
UNEMPLOYMENT AMONG AGES 45 TO 54 YEARS
68.1/ 100
METRIC RATING
157th/ 347
METRIC RANK
4.5%
UNEMPLOYMENT AMONG AGES 45 TO 54 YEARS
49.0/ 100
METRIC RATING
177th/ 347
METRIC RANK
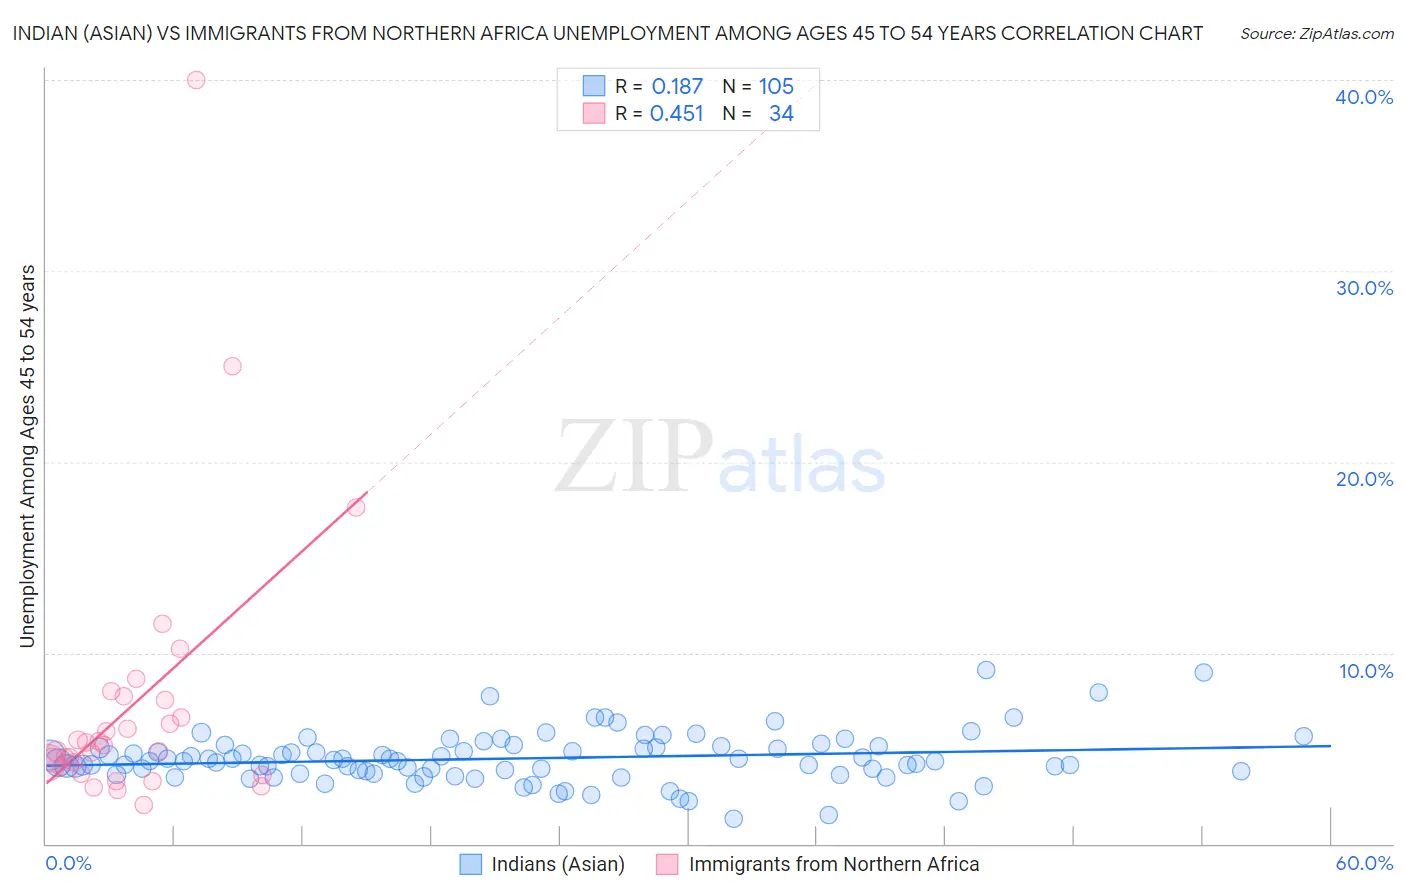
Indian (Asian) vs Immigrants from Northern Africa Unemployment Among Ages 45 to 54 years Correlation Chart
The statistical analysis conducted on geographies consisting of 475,616,910 people shows a poor positive correlation between the proportion of Indians (Asian) and unemployment rate among population between the ages 45 and 54 in the United States with a correlation coefficient (R) of 0.187 and weighted average of 4.5%. Similarly, the statistical analysis conducted on geographies consisting of 316,462,246 people shows a moderate positive correlation between the proportion of Immigrants from Northern Africa and unemployment rate among population between the ages 45 and 54 in the United States with a correlation coefficient (R) of 0.451 and weighted average of 4.5%, a difference of 0.94%.
Unemployment Among Ages 45 to 54 years Correlation Summary
| Measurement | Indian (Asian) | Immigrants from Northern Africa |
| Minimum | 1.3% | 2.0% |
| Maximum | 9.1% | 40.0% |
| Range | 7.8% | 38.0% |
| Mean | 4.5% | 7.3% |
| Median | 4.3% | 5.0% |
| Interquartile 25% (IQ1) | 3.7% | 4.0% |
| Interquartile 75% (IQ3) | 5.1% | 7.5% |
| Interquartile Range (IQR) | 1.3% | 3.5% |
| Standard Deviation (Sample) | 1.3% | 7.3% |
| Standard Deviation (Population) | 1.3% | 7.2% |
Demographics Similar to Indians (Asian) and Immigrants from Northern Africa by Unemployment Among Ages 45 to 54 years
In terms of unemployment among ages 45 to 54 years, the demographic groups most similar to Indians (Asian) are Immigrants from Italy (4.5%, a difference of 0.14%), Nonimmigrants (4.5%, a difference of 0.28%), Immigrants from South Eastern Asia (4.5%, a difference of 0.32%), Immigrants from Eastern Europe (4.5%, a difference of 0.33%), and Immigrants from Indonesia (4.5%, a difference of 0.40%). Similarly, the demographic groups most similar to Immigrants from Northern Africa are Puget Sound Salish (4.5%, a difference of 0.0%), Immigrants from France (4.5%, a difference of 0.020%), Immigrants from Hungary (4.5%, a difference of 0.050%), Immigrants from Colombia (4.5%, a difference of 0.14%), and Colombian (4.5%, a difference of 0.20%).
| Demographics | Rating | Rank | Unemployment Among Ages 45 to 54 years |
| Indians (Asian) | 68.1 /100 | #157 | Good 4.5% |
| Immigrants | Italy | 65.5 /100 | #158 | Good 4.5% |
| Immigrants | Nonimmigrants | 62.8 /100 | #159 | Good 4.5% |
| Immigrants | South Eastern Asia | 62.0 /100 | #160 | Good 4.5% |
| Immigrants | Eastern Europe | 61.6 /100 | #161 | Good 4.5% |
| Immigrants | Indonesia | 60.3 /100 | #162 | Good 4.5% |
| Bangladeshis | 59.7 /100 | #163 | Average 4.5% |
| Samoans | 58.5 /100 | #164 | Average 4.5% |
| Maltese | 57.9 /100 | #165 | Average 4.5% |
| Immigrants | Western Europe | 57.4 /100 | #166 | Average 4.5% |
| Immigrants | Brazil | 56.4 /100 | #167 | Average 4.5% |
| Immigrants | Europe | 54.7 /100 | #168 | Average 4.5% |
| Immigrants | Egypt | 54.7 /100 | #169 | Average 4.5% |
| Spaniards | 54.3 /100 | #170 | Average 4.5% |
| Egyptians | 53.6 /100 | #171 | Average 4.5% |
| Colombians | 53.3 /100 | #172 | Average 4.5% |
| Immigrants | Colombia | 52.0 /100 | #173 | Average 4.5% |
| Immigrants | Hungary | 50.0 /100 | #174 | Average 4.5% |
| Immigrants | France | 49.4 /100 | #175 | Average 4.5% |
| Puget Sound Salish | 49.1 /100 | #176 | Average 4.5% |
| Immigrants | Northern Africa | 49.0 /100 | #177 | Average 4.5% |