Immigrants vs Creek Unemployment Among Ages 25 to 29 years
COMPARE
Immigrants
Creek
Unemployment Among Ages 25 to 29 years
Unemployment Among Ages 25 to 29 years Comparison
Immigrants
Creek
6.9%
UNEMPLOYMENT AMONG AGES 25 TO 29 YEARS
6.2/ 100
METRIC RATING
224th/ 347
METRIC RANK
7.6%
UNEMPLOYMENT AMONG AGES 25 TO 29 YEARS
0.0/ 100
METRIC RATING
283rd/ 347
METRIC RANK
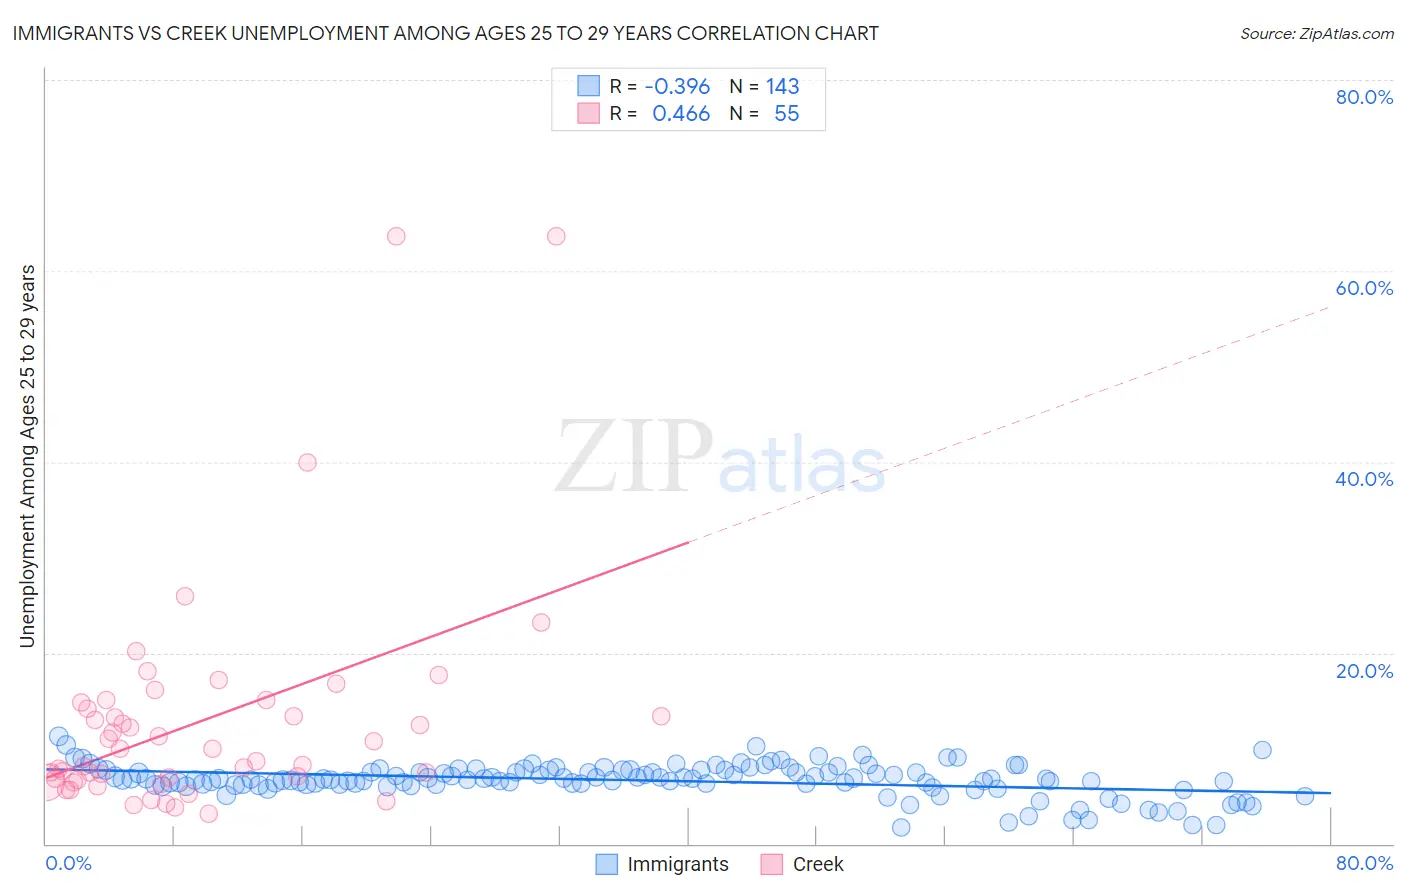
Immigrants vs Creek Unemployment Among Ages 25 to 29 years Correlation Chart
The statistical analysis conducted on geographies consisting of 505,872,211 people shows a mild negative correlation between the proportion of Immigrants and unemployment rate among population between the ages 25 and 29 in the United States with a correlation coefficient (R) of -0.396 and weighted average of 6.9%. Similarly, the statistical analysis conducted on geographies consisting of 172,938,498 people shows a moderate positive correlation between the proportion of Creek and unemployment rate among population between the ages 25 and 29 in the United States with a correlation coefficient (R) of 0.466 and weighted average of 7.6%, a difference of 9.3%.
Unemployment Among Ages 25 to 29 years Correlation Summary
| Measurement | Immigrants | Creek |
| Minimum | 1.7% | 3.2% |
| Maximum | 11.3% | 63.6% |
| Range | 9.6% | 60.4% |
| Mean | 6.6% | 12.9% |
| Median | 6.8% | 10.0% |
| Interquartile 25% (IQ1) | 6.2% | 6.7% |
| Interquartile 75% (IQ3) | 7.7% | 14.8% |
| Interquartile Range (IQR) | 1.5% | 8.1% |
| Standard Deviation (Sample) | 1.7% | 11.8% |
| Standard Deviation (Population) | 1.7% | 11.7% |
Similar Demographics by Unemployment Among Ages 25 to 29 years
Demographics Similar to Immigrants by Unemployment Among Ages 25 to 29 years
In terms of unemployment among ages 25 to 29 years, the demographic groups most similar to Immigrants are Japanese (6.9%, a difference of 0.22%), Celtic (6.9%, a difference of 0.33%), Spaniard (6.9%, a difference of 0.34%), Immigrants from Liberia (7.0%, a difference of 0.41%), and Salvadoran (7.0%, a difference of 0.54%).
| Demographics | Rating | Rank | Unemployment Among Ages 25 to 29 years |
| Ute | 13.4 /100 | #217 | Poor 6.8% |
| Immigrants | Austria | 12.3 /100 | #218 | Poor 6.8% |
| Whites/Caucasians | 10.6 /100 | #219 | Poor 6.9% |
| French | 10.5 /100 | #220 | Poor 6.9% |
| Israelis | 9.8 /100 | #221 | Tragic 6.9% |
| Spaniards | 7.7 /100 | #222 | Tragic 6.9% |
| Celtics | 7.6 /100 | #223 | Tragic 6.9% |
| Immigrants | Immigrants | 6.2 /100 | #224 | Tragic 6.9% |
| Japanese | 5.4 /100 | #225 | Tragic 6.9% |
| Immigrants | Liberia | 4.8 /100 | #226 | Tragic 7.0% |
| Salvadorans | 4.4 /100 | #227 | Tragic 7.0% |
| Immigrants | Panama | 4.2 /100 | #228 | Tragic 7.0% |
| Bermudans | 3.8 /100 | #229 | Tragic 7.0% |
| Immigrants | El Salvador | 3.6 /100 | #230 | Tragic 7.0% |
| Central Americans | 3.0 /100 | #231 | Tragic 7.0% |
Demographics Similar to Creek by Unemployment Among Ages 25 to 29 years
In terms of unemployment among ages 25 to 29 years, the demographic groups most similar to Creek are Cherokee (7.6%, a difference of 0.010%), Senegalese (7.6%, a difference of 0.13%), Immigrants from Senegal (7.6%, a difference of 0.17%), Vietnamese (7.6%, a difference of 0.22%), and Immigrants from Bangladesh (7.5%, a difference of 0.34%).
| Demographics | Rating | Rank | Unemployment Among Ages 25 to 29 years |
| French American Indians | 0.0 /100 | #276 | Tragic 7.5% |
| Iroquois | 0.0 /100 | #277 | Tragic 7.5% |
| Mexicans | 0.0 /100 | #278 | Tragic 7.5% |
| Nepalese | 0.0 /100 | #279 | Tragic 7.5% |
| Immigrants | Caribbean | 0.0 /100 | #280 | Tragic 7.5% |
| Immigrants | Bangladesh | 0.0 /100 | #281 | Tragic 7.5% |
| Immigrants | Senegal | 0.0 /100 | #282 | Tragic 7.6% |
| Creek | 0.0 /100 | #283 | Tragic 7.6% |
| Cherokee | 0.0 /100 | #284 | Tragic 7.6% |
| Senegalese | 0.0 /100 | #285 | Tragic 7.6% |
| Vietnamese | 0.0 /100 | #286 | Tragic 7.6% |
| Immigrants | Mexico | 0.0 /100 | #287 | Tragic 7.6% |
| Africans | 0.0 /100 | #288 | Tragic 7.6% |
| Belizeans | 0.0 /100 | #289 | Tragic 7.7% |
| Armenians | 0.0 /100 | #290 | Tragic 7.7% |