Basque vs Creek Unemployment Among Ages 25 to 29 years
COMPARE
Basque
Creek
Unemployment Among Ages 25 to 29 years
Unemployment Among Ages 25 to 29 years Comparison
Basques
Creek
6.8%
UNEMPLOYMENT AMONG AGES 25 TO 29 YEARS
22.5/ 100
METRIC RATING
201st/ 347
METRIC RANK
7.6%
UNEMPLOYMENT AMONG AGES 25 TO 29 YEARS
0.0/ 100
METRIC RATING
283rd/ 347
METRIC RANK
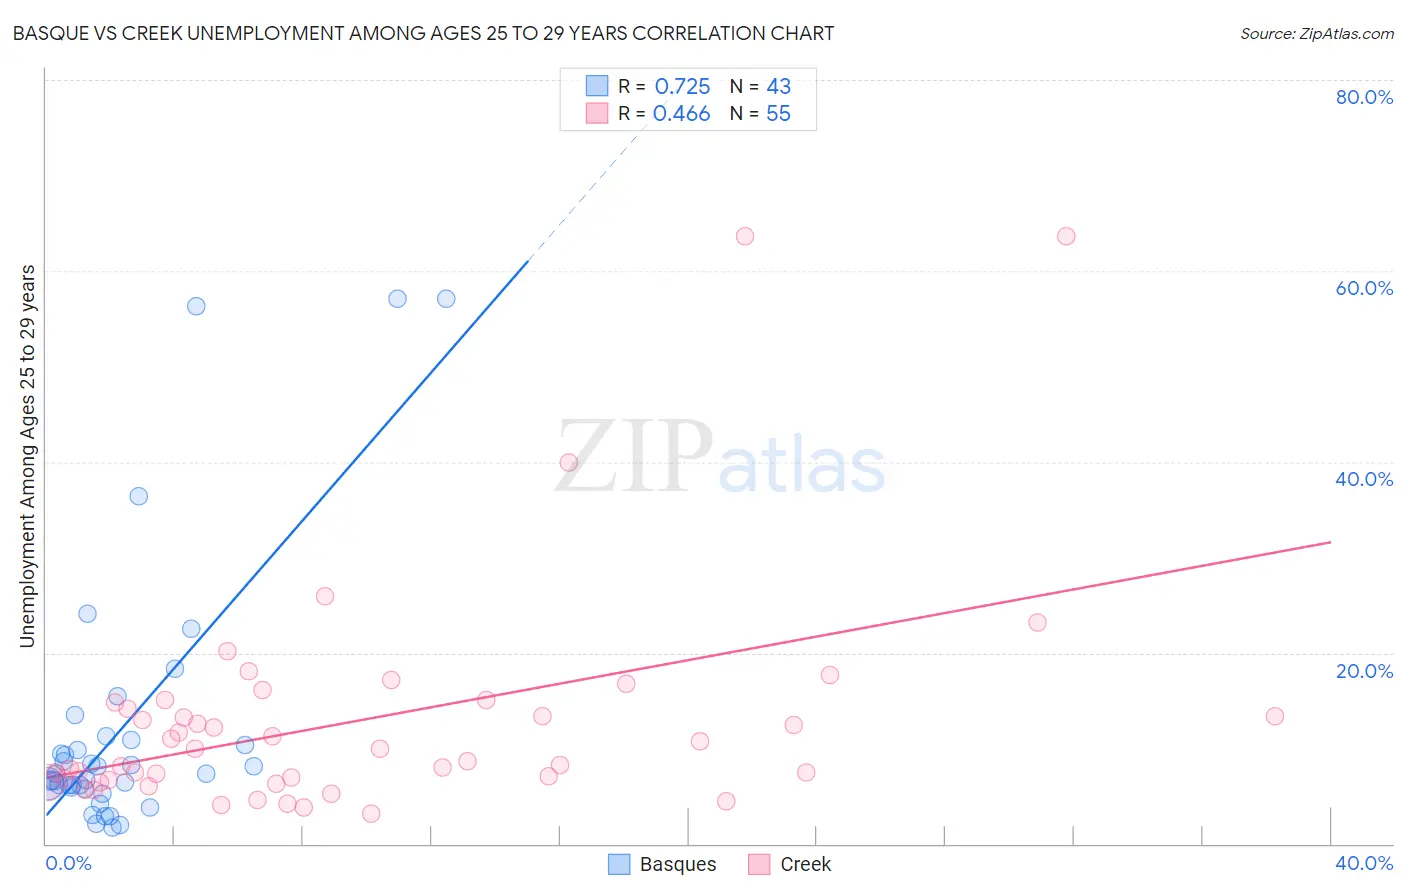
Basque vs Creek Unemployment Among Ages 25 to 29 years Correlation Chart
The statistical analysis conducted on geographies consisting of 162,150,990 people shows a strong positive correlation between the proportion of Basques and unemployment rate among population between the ages 25 and 29 in the United States with a correlation coefficient (R) of 0.725 and weighted average of 6.8%. Similarly, the statistical analysis conducted on geographies consisting of 172,938,498 people shows a moderate positive correlation between the proportion of Creek and unemployment rate among population between the ages 25 and 29 in the United States with a correlation coefficient (R) of 0.466 and weighted average of 7.6%, a difference of 11.8%.
Unemployment Among Ages 25 to 29 years Correlation Summary
| Measurement | Basque | Creek |
| Minimum | 1.7% | 3.2% |
| Maximum | 57.1% | 63.6% |
| Range | 55.4% | 60.4% |
| Mean | 12.1% | 12.9% |
| Median | 7.3% | 10.0% |
| Interquartile 25% (IQ1) | 5.9% | 6.7% |
| Interquartile 75% (IQ3) | 10.9% | 14.8% |
| Interquartile Range (IQR) | 5.0% | 8.1% |
| Standard Deviation (Sample) | 14.0% | 11.8% |
| Standard Deviation (Population) | 13.8% | 11.7% |
Similar Demographics by Unemployment Among Ages 25 to 29 years
Demographics Similar to Basques by Unemployment Among Ages 25 to 29 years
In terms of unemployment among ages 25 to 29 years, the demographic groups most similar to Basques are South American Indian (6.8%, a difference of 0.070%), Immigrants from Argentina (6.8%, a difference of 0.080%), Immigrants from Norway (6.8%, a difference of 0.11%), Guamanian/Chamorro (6.8%, a difference of 0.15%), and Immigrants from Southern Europe (6.8%, a difference of 0.17%).
| Demographics | Rating | Rank | Unemployment Among Ages 25 to 29 years |
| Immigrants | Greece | 28.0 /100 | #194 | Fair 6.7% |
| Immigrants | Western Asia | 27.3 /100 | #195 | Fair 6.7% |
| Hungarians | 26.8 /100 | #196 | Fair 6.8% |
| Italians | 26.5 /100 | #197 | Fair 6.8% |
| Immigrants | Southern Europe | 24.6 /100 | #198 | Fair 6.8% |
| Guamanians/Chamorros | 24.3 /100 | #199 | Fair 6.8% |
| South American Indians | 23.3 /100 | #200 | Fair 6.8% |
| Basques | 22.5 /100 | #201 | Fair 6.8% |
| Immigrants | Argentina | 21.6 /100 | #202 | Fair 6.8% |
| Immigrants | Norway | 21.2 /100 | #203 | Fair 6.8% |
| Scotch-Irish | 20.0 /100 | #204 | Poor 6.8% |
| Immigrants | England | 19.8 /100 | #205 | Poor 6.8% |
| Ugandans | 19.8 /100 | #206 | Poor 6.8% |
| Immigrants | Denmark | 19.0 /100 | #207 | Poor 6.8% |
| Immigrants | Germany | 18.8 /100 | #208 | Poor 6.8% |
Demographics Similar to Creek by Unemployment Among Ages 25 to 29 years
In terms of unemployment among ages 25 to 29 years, the demographic groups most similar to Creek are Cherokee (7.6%, a difference of 0.010%), Senegalese (7.6%, a difference of 0.13%), Immigrants from Senegal (7.6%, a difference of 0.17%), Vietnamese (7.6%, a difference of 0.22%), and Immigrants from Bangladesh (7.5%, a difference of 0.34%).
| Demographics | Rating | Rank | Unemployment Among Ages 25 to 29 years |
| French American Indians | 0.0 /100 | #276 | Tragic 7.5% |
| Iroquois | 0.0 /100 | #277 | Tragic 7.5% |
| Mexicans | 0.0 /100 | #278 | Tragic 7.5% |
| Nepalese | 0.0 /100 | #279 | Tragic 7.5% |
| Immigrants | Caribbean | 0.0 /100 | #280 | Tragic 7.5% |
| Immigrants | Bangladesh | 0.0 /100 | #281 | Tragic 7.5% |
| Immigrants | Senegal | 0.0 /100 | #282 | Tragic 7.6% |
| Creek | 0.0 /100 | #283 | Tragic 7.6% |
| Cherokee | 0.0 /100 | #284 | Tragic 7.6% |
| Senegalese | 0.0 /100 | #285 | Tragic 7.6% |
| Vietnamese | 0.0 /100 | #286 | Tragic 7.6% |
| Immigrants | Mexico | 0.0 /100 | #287 | Tragic 7.6% |
| Africans | 0.0 /100 | #288 | Tragic 7.6% |
| Belizeans | 0.0 /100 | #289 | Tragic 7.7% |
| Armenians | 0.0 /100 | #290 | Tragic 7.7% |