Immigrants from Zimbabwe vs Pima Unemployment Among Ages 25 to 29 years
COMPARE
Immigrants from Zimbabwe
Pima
Unemployment Among Ages 25 to 29 years
Unemployment Among Ages 25 to 29 years Comparison
Immigrants from Zimbabwe
Pima
6.1%
UNEMPLOYMENT AMONG AGES 25 TO 29 YEARS
99.5/ 100
METRIC RATING
35th/ 347
METRIC RANK
11.8%
UNEMPLOYMENT AMONG AGES 25 TO 29 YEARS
0.0/ 100
METRIC RATING
339th/ 347
METRIC RANK
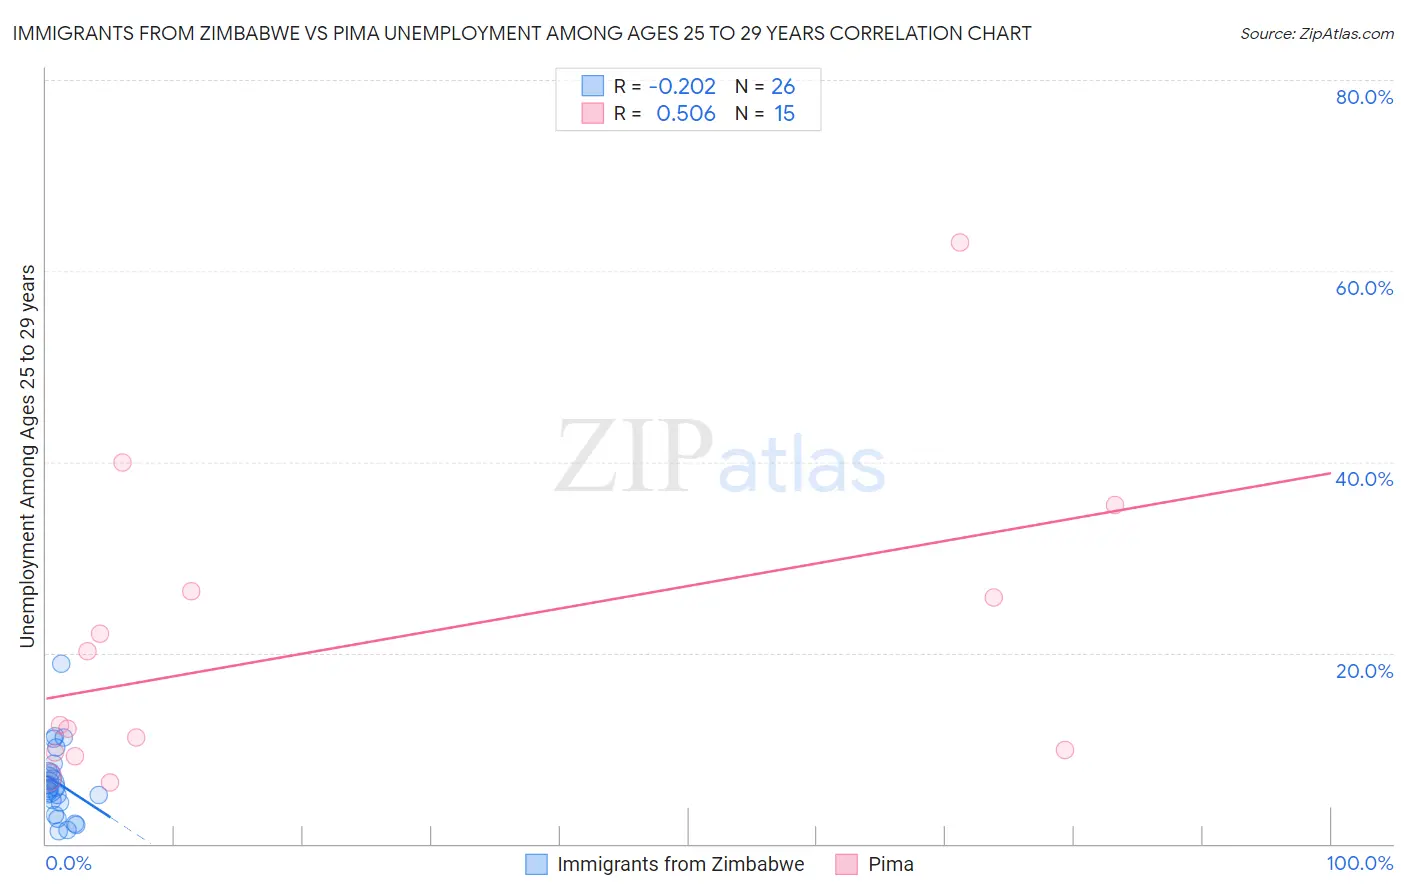
Immigrants from Zimbabwe vs Pima Unemployment Among Ages 25 to 29 years Correlation Chart
The statistical analysis conducted on geographies consisting of 116,035,324 people shows a weak negative correlation between the proportion of Immigrants from Zimbabwe and unemployment rate among population between the ages 25 and 29 in the United States with a correlation coefficient (R) of -0.202 and weighted average of 6.1%. Similarly, the statistical analysis conducted on geographies consisting of 61,065,971 people shows a substantial positive correlation between the proportion of Pima and unemployment rate among population between the ages 25 and 29 in the United States with a correlation coefficient (R) of 0.506 and weighted average of 11.8%, a difference of 92.7%.
Unemployment Among Ages 25 to 29 years Correlation Summary
| Measurement | Immigrants from Zimbabwe | Pima |
| Minimum | 1.3% | 6.4% |
| Maximum | 18.8% | 63.0% |
| Range | 17.5% | 56.6% |
| Mean | 6.4% | 20.7% |
| Median | 5.8% | 12.5% |
| Interquartile 25% (IQ1) | 4.4% | 9.6% |
| Interquartile 75% (IQ3) | 7.6% | 26.5% |
| Interquartile Range (IQR) | 3.2% | 16.9% |
| Standard Deviation (Sample) | 3.8% | 15.7% |
| Standard Deviation (Population) | 3.8% | 15.2% |
Similar Demographics by Unemployment Among Ages 25 to 29 years
Demographics Similar to Immigrants from Zimbabwe by Unemployment Among Ages 25 to 29 years
In terms of unemployment among ages 25 to 29 years, the demographic groups most similar to Immigrants from Zimbabwe are Taiwanese (6.1%, a difference of 0.020%), Immigrants from Morocco (6.1%, a difference of 0.040%), Immigrants from Serbia (6.1%, a difference of 0.070%), Ethiopian (6.1%, a difference of 0.21%), and Yugoslavian (6.1%, a difference of 0.30%).
| Demographics | Rating | Rank | Unemployment Among Ages 25 to 29 years |
| Danes | 99.7 /100 | #28 | Exceptional 6.0% |
| Immigrants | South Central Asia | 99.7 /100 | #29 | Exceptional 6.1% |
| Bulgarians | 99.7 /100 | #30 | Exceptional 6.1% |
| Filipinos | 99.7 /100 | #31 | Exceptional 6.1% |
| Chinese | 99.6 /100 | #32 | Exceptional 6.1% |
| Yugoslavians | 99.6 /100 | #33 | Exceptional 6.1% |
| Immigrants | Morocco | 99.5 /100 | #34 | Exceptional 6.1% |
| Immigrants | Zimbabwe | 99.5 /100 | #35 | Exceptional 6.1% |
| Taiwanese | 99.5 /100 | #36 | Exceptional 6.1% |
| Immigrants | Serbia | 99.5 /100 | #37 | Exceptional 6.1% |
| Ethiopians | 99.4 /100 | #38 | Exceptional 6.1% |
| Indonesians | 99.3 /100 | #39 | Exceptional 6.1% |
| Immigrants | Kenya | 99.3 /100 | #40 | Exceptional 6.1% |
| Fijians | 99.3 /100 | #41 | Exceptional 6.1% |
| Jordanians | 99.3 /100 | #42 | Exceptional 6.1% |
Demographics Similar to Pima by Unemployment Among Ages 25 to 29 years
In terms of unemployment among ages 25 to 29 years, the demographic groups most similar to Pima are Cheyenne (11.8%, a difference of 0.42%), Sioux (11.7%, a difference of 0.94%), Tohono O'odham (12.1%, a difference of 2.5%), Navajo (12.2%, a difference of 3.4%), and Menominee (11.3%, a difference of 4.5%).
| Demographics | Rating | Rank | Unemployment Among Ages 25 to 29 years |
| Pueblo | 0.0 /100 | #332 | Tragic 10.4% |
| Alaskan Athabascans | 0.0 /100 | #333 | Tragic 10.8% |
| Yuman | 0.0 /100 | #334 | Tragic 11.0% |
| Puerto Ricans | 0.0 /100 | #335 | Tragic 11.1% |
| Lumbee | 0.0 /100 | #336 | Tragic 11.2% |
| Menominee | 0.0 /100 | #337 | Tragic 11.3% |
| Sioux | 0.0 /100 | #338 | Tragic 11.7% |
| Pima | 0.0 /100 | #339 | Tragic 11.8% |
| Cheyenne | 0.0 /100 | #340 | Tragic 11.8% |
| Tohono O'odham | 0.0 /100 | #341 | Tragic 12.1% |
| Navajo | 0.0 /100 | #342 | Tragic 12.2% |
| Inupiat | 0.0 /100 | #343 | Tragic 13.4% |
| Hopi | 0.0 /100 | #344 | Tragic 13.5% |
| Arapaho | 0.0 /100 | #345 | Tragic 15.4% |
| Crow | 0.0 /100 | #346 | Tragic 15.4% |