Immigrants from Zaire vs Colville Unemployment Among Seniors over 75 years
COMPARE
Immigrants from Zaire
Colville
Unemployment Among Seniors over 75 years
Unemployment Among Seniors over 75 years Comparison
Immigrants from Zaire
Colville
7.2%
UNEMPLOYMENT AMONG SENIORS OVER 75 YEARS
100.0/ 100
METRIC RATING
19th/ 347
METRIC RANK
7.7%
UNEMPLOYMENT AMONG SENIORS OVER 75 YEARS
100.0/ 100
METRIC RATING
40th/ 347
METRIC RANK
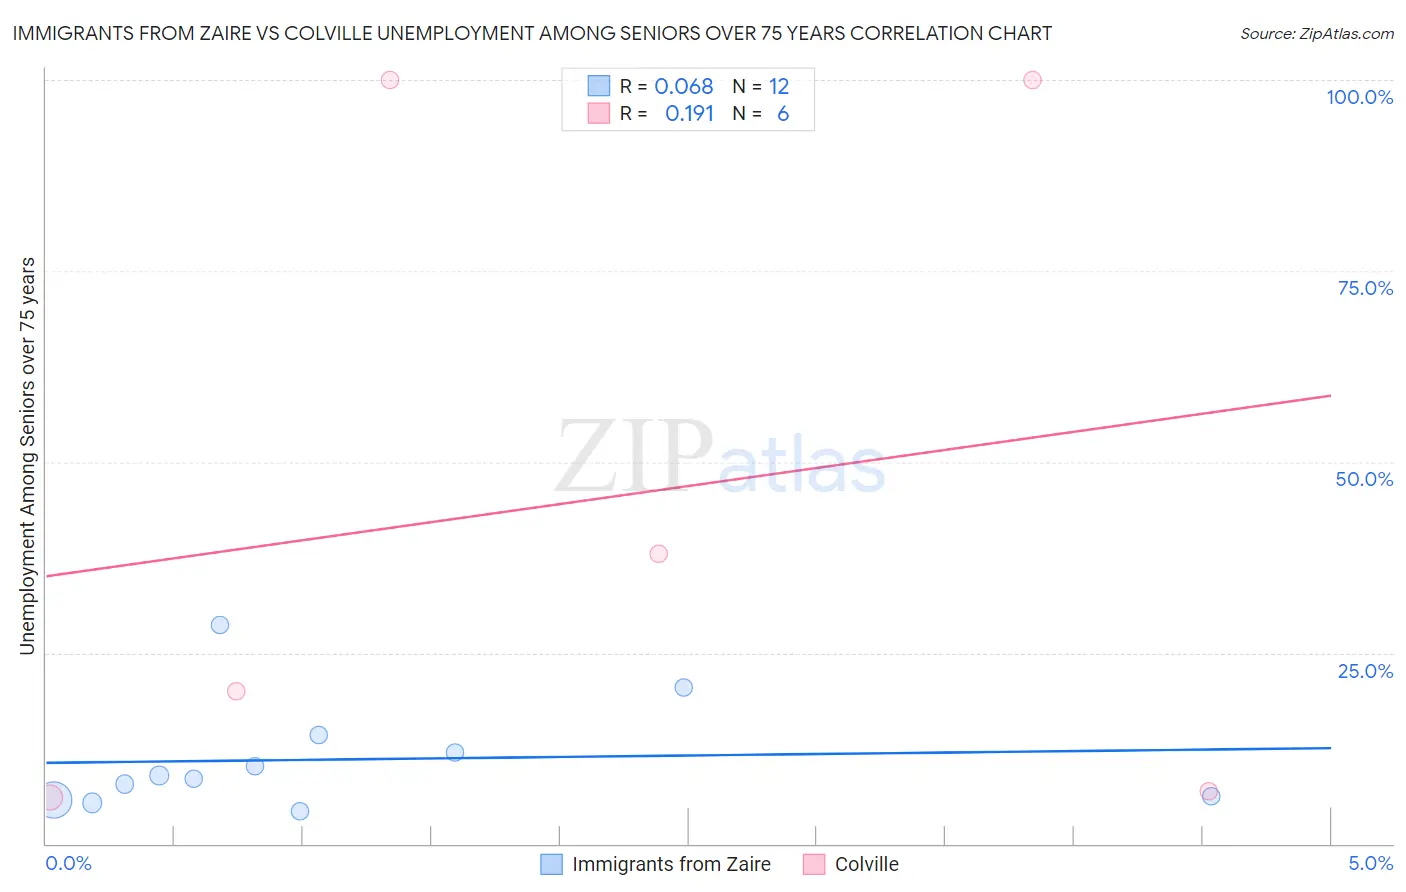
Immigrants from Zaire vs Colville Unemployment Among Seniors over 75 years Correlation Chart
The statistical analysis conducted on geographies consisting of 78,905,423 people shows a slight positive correlation between the proportion of Immigrants from Zaire and unemployment rate among seniors over the age of 75 in the United States with a correlation coefficient (R) of 0.068 and weighted average of 7.2%. Similarly, the statistical analysis conducted on geographies consisting of 27,779,106 people shows a poor positive correlation between the proportion of Colville and unemployment rate among seniors over the age of 75 in the United States with a correlation coefficient (R) of 0.191 and weighted average of 7.7%, a difference of 6.8%.
Unemployment Among Seniors over 75 years Correlation Summary
| Measurement | Immigrants from Zaire | Colville |
| Minimum | 4.3% | 6.1% |
| Maximum | 28.6% | 100.0% |
| Range | 24.3% | 93.9% |
| Mean | 11.0% | 45.1% |
| Median | 8.7% | 28.9% |
| Interquartile 25% (IQ1) | 6.0% | 6.9% |
| Interquartile 75% (IQ3) | 13.2% | 100.0% |
| Interquartile Range (IQR) | 7.1% | 93.1% |
| Standard Deviation (Sample) | 7.1% | 44.0% |
| Standard Deviation (Population) | 6.8% | 40.2% |
Similar Demographics by Unemployment Among Seniors over 75 years
Demographics Similar to Immigrants from Zaire by Unemployment Among Seniors over 75 years
In terms of unemployment among seniors over 75 years, the demographic groups most similar to Immigrants from Zaire are Immigrants from Uzbekistan (7.2%, a difference of 0.080%), Armenian (7.2%, a difference of 0.35%), Immigrants from Switzerland (7.2%, a difference of 0.38%), Seminole (7.1%, a difference of 1.4%), and Chickasaw (7.3%, a difference of 1.7%).
| Demographics | Rating | Rank | Unemployment Among Seniors over 75 years |
| Comanche | 100.0 /100 | #12 | Exceptional 6.7% |
| Immigrants | Congo | 100.0 /100 | #13 | Exceptional 6.7% |
| Ute | 100.0 /100 | #14 | Exceptional 6.8% |
| Icelanders | 100.0 /100 | #15 | Exceptional 7.0% |
| Seminole | 100.0 /100 | #16 | Exceptional 7.1% |
| Immigrants | Switzerland | 100.0 /100 | #17 | Exceptional 7.2% |
| Immigrants | Uzbekistan | 100.0 /100 | #18 | Exceptional 7.2% |
| Immigrants | Zaire | 100.0 /100 | #19 | Exceptional 7.2% |
| Armenians | 100.0 /100 | #20 | Exceptional 7.2% |
| Chickasaw | 100.0 /100 | #21 | Exceptional 7.3% |
| Cypriots | 100.0 /100 | #22 | Exceptional 7.4% |
| Israelis | 100.0 /100 | #23 | Exceptional 7.4% |
| Immigrants | Cuba | 100.0 /100 | #24 | Exceptional 7.4% |
| Immigrants | Uruguay | 100.0 /100 | #25 | Exceptional 7.5% |
| South Africans | 100.0 /100 | #26 | Exceptional 7.5% |
Demographics Similar to Colville by Unemployment Among Seniors over 75 years
In terms of unemployment among seniors over 75 years, the demographic groups most similar to Colville are Ugandan (7.7%, a difference of 0.020%), Kiowa (7.7%, a difference of 0.060%), Immigrants from Hungary (7.7%, a difference of 0.080%), Immigrants from Burma/Myanmar (7.7%, a difference of 0.13%), and Luxembourger (7.7%, a difference of 0.28%).
| Demographics | Rating | Rank | Unemployment Among Seniors over 75 years |
| Cambodians | 100.0 /100 | #33 | Exceptional 7.6% |
| Immigrants | Eritrea | 100.0 /100 | #34 | Exceptional 7.7% |
| Immigrants | Norway | 100.0 /100 | #35 | Exceptional 7.7% |
| Luxembourgers | 100.0 /100 | #36 | Exceptional 7.7% |
| Immigrants | Hungary | 100.0 /100 | #37 | Exceptional 7.7% |
| Kiowa | 100.0 /100 | #38 | Exceptional 7.7% |
| Ugandans | 100.0 /100 | #39 | Exceptional 7.7% |
| Colville | 100.0 /100 | #40 | Exceptional 7.7% |
| Immigrants | Burma/Myanmar | 100.0 /100 | #41 | Exceptional 7.7% |
| Pueblo | 100.0 /100 | #42 | Exceptional 7.7% |
| Immigrants | Denmark | 100.0 /100 | #43 | Exceptional 7.8% |
| Immigrants | Spain | 100.0 /100 | #44 | Exceptional 7.8% |
| British West Indians | 100.0 /100 | #45 | Exceptional 7.8% |
| Immigrants | China | 100.0 /100 | #46 | Exceptional 7.8% |
| Creek | 100.0 /100 | #47 | Exceptional 7.8% |