Guatemalan vs Colville Unemployment Among Seniors over 75 years
COMPARE
Guatemalan
Colville
Unemployment Among Seniors over 75 years
Unemployment Among Seniors over 75 years Comparison
Guatemalans
Colville
8.8%
UNEMPLOYMENT AMONG SENIORS OVER 75 YEARS
39.5/ 100
METRIC RATING
182nd/ 347
METRIC RANK
7.7%
UNEMPLOYMENT AMONG SENIORS OVER 75 YEARS
100.0/ 100
METRIC RATING
40th/ 347
METRIC RANK
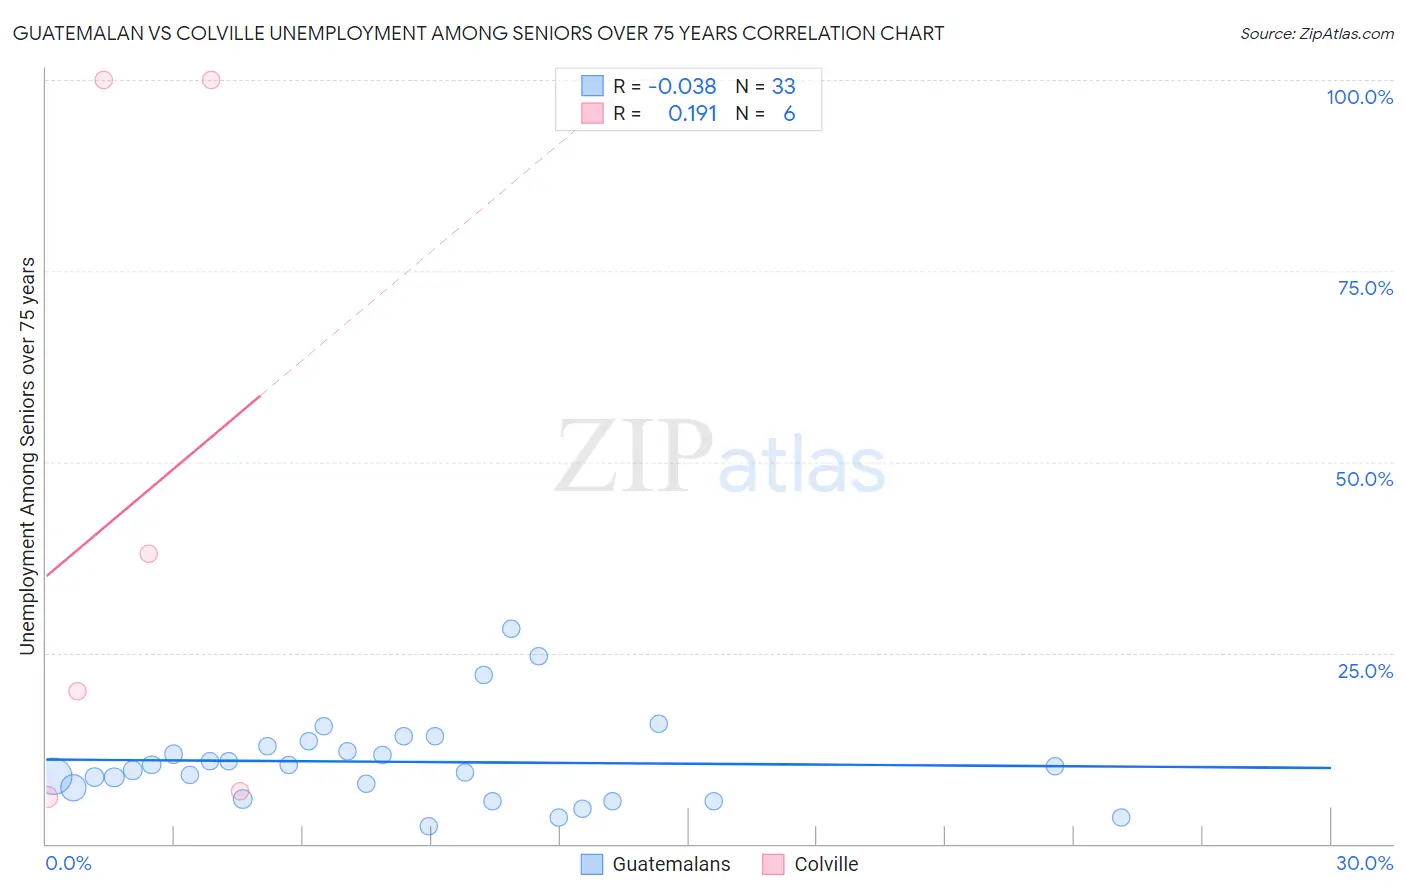
Guatemalan vs Colville Unemployment Among Seniors over 75 years Correlation Chart
The statistical analysis conducted on geographies consisting of 204,244,700 people shows no correlation between the proportion of Guatemalans and unemployment rate among seniors over the age of 75 in the United States with a correlation coefficient (R) of -0.038 and weighted average of 8.8%. Similarly, the statistical analysis conducted on geographies consisting of 27,779,106 people shows a poor positive correlation between the proportion of Colville and unemployment rate among seniors over the age of 75 in the United States with a correlation coefficient (R) of 0.191 and weighted average of 7.7%, a difference of 14.1%.
Unemployment Among Seniors over 75 years Correlation Summary
| Measurement | Guatemalan | Colville |
| Minimum | 2.3% | 6.1% |
| Maximum | 28.2% | 100.0% |
| Range | 25.9% | 93.9% |
| Mean | 10.7% | 45.1% |
| Median | 10.1% | 28.9% |
| Interquartile 25% (IQ1) | 6.6% | 6.9% |
| Interquartile 75% (IQ3) | 13.1% | 100.0% |
| Interquartile Range (IQR) | 6.5% | 93.1% |
| Standard Deviation (Sample) | 5.8% | 44.0% |
| Standard Deviation (Population) | 5.7% | 40.2% |
Similar Demographics by Unemployment Among Seniors over 75 years
Demographics Similar to Guatemalans by Unemployment Among Seniors over 75 years
In terms of unemployment among seniors over 75 years, the demographic groups most similar to Guatemalans are Immigrants from Thailand (8.8%, a difference of 0.040%), Immigrants from Afghanistan (8.8%, a difference of 0.070%), Immigrants from Italy (8.8%, a difference of 0.12%), Immigrants from Somalia (8.8%, a difference of 0.12%), and West Indian (8.8%, a difference of 0.13%).
| Demographics | Rating | Rank | Unemployment Among Seniors over 75 years |
| Syrians | 49.6 /100 | #175 | Average 8.7% |
| Somalis | 45.3 /100 | #176 | Average 8.8% |
| Central Americans | 43.3 /100 | #177 | Average 8.8% |
| West Indians | 41.9 /100 | #178 | Average 8.8% |
| Immigrants | Italy | 41.7 /100 | #179 | Average 8.8% |
| Immigrants | Somalia | 41.7 /100 | #180 | Average 8.8% |
| Immigrants | Thailand | 40.2 /100 | #181 | Average 8.8% |
| Guatemalans | 39.5 /100 | #182 | Fair 8.8% |
| Immigrants | Afghanistan | 38.2 /100 | #183 | Fair 8.8% |
| Immigrants | Micronesia | 37.2 /100 | #184 | Fair 8.8% |
| Choctaw | 37.1 /100 | #185 | Fair 8.8% |
| Immigrants | Ethiopia | 36.2 /100 | #186 | Fair 8.8% |
| Immigrants | Europe | 35.2 /100 | #187 | Fair 8.8% |
| Immigrants | Eastern Europe | 34.7 /100 | #188 | Fair 8.8% |
| Immigrants | Haiti | 34.7 /100 | #189 | Fair 8.8% |
Demographics Similar to Colville by Unemployment Among Seniors over 75 years
In terms of unemployment among seniors over 75 years, the demographic groups most similar to Colville are Ugandan (7.7%, a difference of 0.020%), Kiowa (7.7%, a difference of 0.060%), Immigrants from Hungary (7.7%, a difference of 0.080%), Immigrants from Burma/Myanmar (7.7%, a difference of 0.13%), and Luxembourger (7.7%, a difference of 0.28%).
| Demographics | Rating | Rank | Unemployment Among Seniors over 75 years |
| Cambodians | 100.0 /100 | #33 | Exceptional 7.6% |
| Immigrants | Eritrea | 100.0 /100 | #34 | Exceptional 7.7% |
| Immigrants | Norway | 100.0 /100 | #35 | Exceptional 7.7% |
| Luxembourgers | 100.0 /100 | #36 | Exceptional 7.7% |
| Immigrants | Hungary | 100.0 /100 | #37 | Exceptional 7.7% |
| Kiowa | 100.0 /100 | #38 | Exceptional 7.7% |
| Ugandans | 100.0 /100 | #39 | Exceptional 7.7% |
| Colville | 100.0 /100 | #40 | Exceptional 7.7% |
| Immigrants | Burma/Myanmar | 100.0 /100 | #41 | Exceptional 7.7% |
| Pueblo | 100.0 /100 | #42 | Exceptional 7.7% |
| Immigrants | Denmark | 100.0 /100 | #43 | Exceptional 7.8% |
| Immigrants | Spain | 100.0 /100 | #44 | Exceptional 7.8% |
| British West Indians | 100.0 /100 | #45 | Exceptional 7.8% |
| Immigrants | China | 100.0 /100 | #46 | Exceptional 7.8% |
| Creek | 100.0 /100 | #47 | Exceptional 7.8% |