Immigrants from Yemen vs Puget Sound Salish Female Unemployment
COMPARE
Immigrants from Yemen
Puget Sound Salish
Female Unemployment
Female Unemployment Comparison
Immigrants from Yemen
Puget Sound Salish
7.8%
FEMALE UNEMPLOYMENT
0.0/ 100
METRIC RATING
339th/ 347
METRIC RANK
5.1%
FEMALE UNEMPLOYMENT
93.0/ 100
METRIC RATING
108th/ 347
METRIC RANK
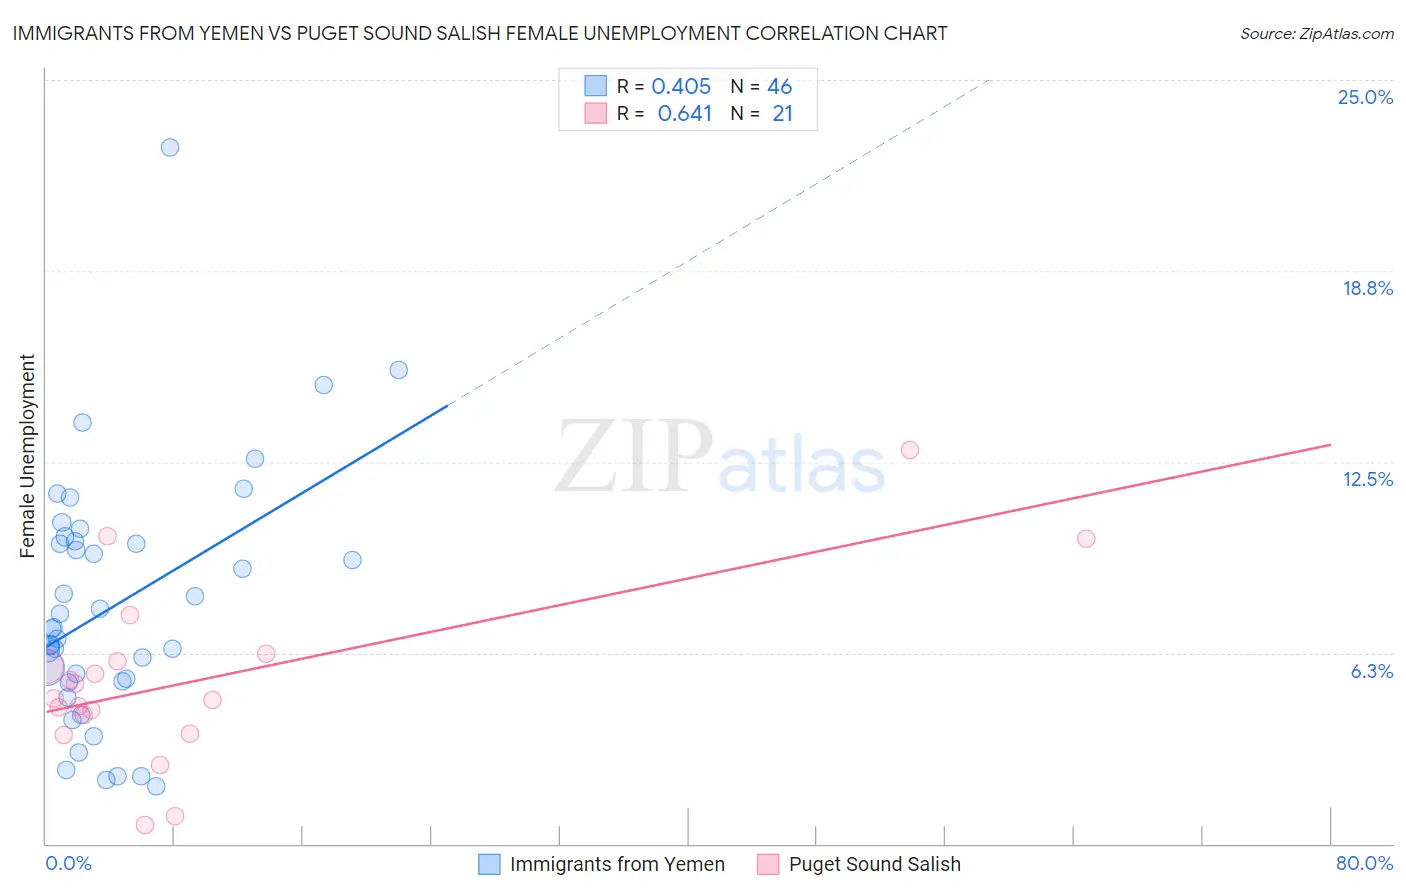
Immigrants from Yemen vs Puget Sound Salish Female Unemployment Correlation Chart
The statistical analysis conducted on geographies consisting of 82,406,299 people shows a moderate positive correlation between the proportion of Immigrants from Yemen and unemploymnet rate among females in the United States with a correlation coefficient (R) of 0.405 and weighted average of 7.8%. Similarly, the statistical analysis conducted on geographies consisting of 46,055,319 people shows a significant positive correlation between the proportion of Puget Sound Salish and unemploymnet rate among females in the United States with a correlation coefficient (R) of 0.641 and weighted average of 5.1%, a difference of 55.1%.
Female Unemployment Correlation Summary
| Measurement | Immigrants from Yemen | Puget Sound Salish |
| Minimum | 1.9% | 0.60% |
| Maximum | 22.8% | 12.9% |
| Range | 20.9% | 12.3% |
| Mean | 7.8% | 5.4% |
| Median | 7.1% | 4.8% |
| Interquartile 25% (IQ1) | 5.3% | 3.9% |
| Interquartile 75% (IQ3) | 9.9% | 6.1% |
| Interquartile Range (IQR) | 4.6% | 2.2% |
| Standard Deviation (Sample) | 4.1% | 2.9% |
| Standard Deviation (Population) | 4.1% | 2.8% |
Similar Demographics by Female Unemployment
Demographics Similar to Immigrants from Yemen by Female Unemployment
In terms of female unemployment, the demographic groups most similar to Immigrants from Yemen are Tohono O'odham (7.7%, a difference of 1.2%), Hopi (8.1%, a difference of 3.3%), Inupiat (8.2%, a difference of 4.1%), Puerto Rican (8.3%, a difference of 6.4%), and Navajo (7.3%, a difference of 7.6%).
| Demographics | Rating | Rank | Female Unemployment |
| Sioux | 0.0 /100 | #332 | Tragic 7.0% |
| Menominee | 0.0 /100 | #333 | Tragic 7.0% |
| Immigrants | Armenia | 0.0 /100 | #334 | Tragic 7.1% |
| Dominicans | 0.0 /100 | #335 | Tragic 7.2% |
| Immigrants | Dominican Republic | 0.0 /100 | #336 | Tragic 7.2% |
| Navajo | 0.0 /100 | #337 | Tragic 7.3% |
| Tohono O'odham | 0.0 /100 | #338 | Tragic 7.7% |
| Immigrants | Yemen | 0.0 /100 | #339 | Tragic 7.8% |
| Hopi | 0.0 /100 | #340 | Tragic 8.1% |
| Inupiat | 0.0 /100 | #341 | Tragic 8.2% |
| Puerto Ricans | 0.0 /100 | #342 | Tragic 8.3% |
| Arapaho | 0.0 /100 | #343 | Tragic 8.8% |
| Pima | 0.0 /100 | #344 | Tragic 9.3% |
| Yuman | 0.0 /100 | #345 | Tragic 9.6% |
| Yup'ik | 0.0 /100 | #346 | Tragic 10.9% |
Demographics Similar to Puget Sound Salish by Female Unemployment
In terms of female unemployment, the demographic groups most similar to Puget Sound Salish are Immigrants from Switzerland (5.1%, a difference of 0.020%), Immigrants from Eastern Africa (5.1%, a difference of 0.040%), Paraguayan (5.1%, a difference of 0.050%), Immigrants from England (5.0%, a difference of 0.14%), and Macedonian (5.1%, a difference of 0.14%).
| Demographics | Rating | Rank | Female Unemployment |
| Immigrants | Czechoslovakia | 95.0 /100 | #101 | Exceptional 5.0% |
| Immigrants | Kenya | 94.8 /100 | #102 | Exceptional 5.0% |
| Somalis | 94.6 /100 | #103 | Exceptional 5.0% |
| Kenyans | 93.7 /100 | #104 | Exceptional 5.0% |
| Immigrants | England | 93.6 /100 | #105 | Exceptional 5.0% |
| Paraguayans | 93.2 /100 | #106 | Exceptional 5.1% |
| Immigrants | Switzerland | 93.1 /100 | #107 | Exceptional 5.1% |
| Puget Sound Salish | 93.0 /100 | #108 | Exceptional 5.1% |
| Immigrants | Eastern Africa | 92.8 /100 | #109 | Exceptional 5.1% |
| Macedonians | 92.4 /100 | #110 | Exceptional 5.1% |
| Immigrants | Burma/Myanmar | 92.3 /100 | #111 | Exceptional 5.1% |
| Estonians | 92.1 /100 | #112 | Exceptional 5.1% |
| Immigrants | Saudi Arabia | 91.2 /100 | #113 | Exceptional 5.1% |
| Immigrants | Turkey | 91.0 /100 | #114 | Exceptional 5.1% |
| Lebanese | 91.0 /100 | #115 | Exceptional 5.1% |