Immigrants from Yemen vs Immigrants from Guatemala Unemployment
COMPARE
Immigrants from Yemen
Immigrants from Guatemala
Unemployment
Unemployment Comparison
Immigrants from Yemen
Immigrants from Guatemala
7.7%
UNEMPLOYMENT
0.0/ 100
METRIC RATING
336th/ 347
METRIC RANK
5.8%
UNEMPLOYMENT
0.1/ 100
METRIC RATING
261st/ 347
METRIC RANK
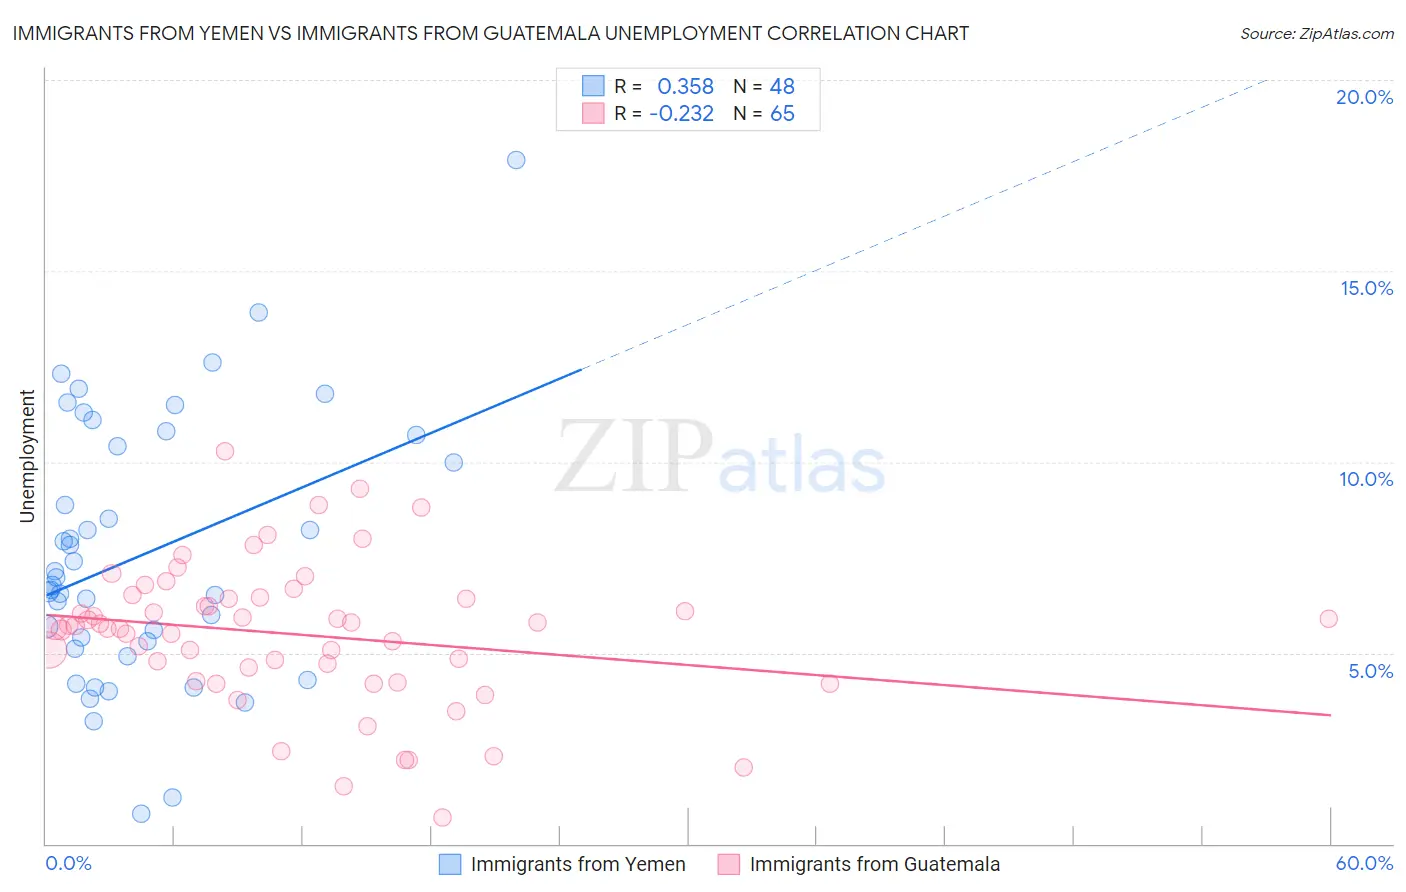
Immigrants from Yemen vs Immigrants from Guatemala Unemployment Correlation Chart
The statistical analysis conducted on geographies consisting of 82,429,488 people shows a mild positive correlation between the proportion of Immigrants from Yemen and unemployment in the United States with a correlation coefficient (R) of 0.358 and weighted average of 7.7%. Similarly, the statistical analysis conducted on geographies consisting of 376,960,601 people shows a weak negative correlation between the proportion of Immigrants from Guatemala and unemployment in the United States with a correlation coefficient (R) of -0.232 and weighted average of 5.8%, a difference of 33.0%.
Unemployment Correlation Summary
| Measurement | Immigrants from Yemen | Immigrants from Guatemala |
| Minimum | 0.80% | 0.70% |
| Maximum | 17.9% | 10.3% |
| Range | 17.1% | 9.6% |
| Mean | 7.6% | 5.5% |
| Median | 6.9% | 5.7% |
| Interquartile 25% (IQ1) | 5.2% | 4.4% |
| Interquartile 75% (IQ3) | 10.6% | 6.4% |
| Interquartile Range (IQR) | 5.4% | 2.0% |
| Standard Deviation (Sample) | 3.5% | 1.9% |
| Standard Deviation (Population) | 3.4% | 1.8% |
Similar Demographics by Unemployment
Demographics Similar to Immigrants from Yemen by Unemployment
In terms of unemployment, the demographic groups most similar to Immigrants from Yemen are Alaskan Athabascan (7.7%, a difference of 0.72%), Apache (7.4%, a difference of 3.8%), Cheyenne (8.0%, a difference of 3.8%), Immigrants from Dominican Republic (7.4%, a difference of 4.3%), and Sioux (7.4%, a difference of 4.3%).
| Demographics | Rating | Rank | Unemployment |
| Alaska Natives | 0.0 /100 | #329 | Tragic 7.2% |
| Yakama | 0.0 /100 | #330 | Tragic 7.3% |
| Dominicans | 0.0 /100 | #331 | Tragic 7.4% |
| Sioux | 0.0 /100 | #332 | Tragic 7.4% |
| Immigrants | Dominican Republic | 0.0 /100 | #333 | Tragic 7.4% |
| Apache | 0.0 /100 | #334 | Tragic 7.4% |
| Alaskan Athabascans | 0.0 /100 | #335 | Tragic 7.7% |
| Immigrants | Yemen | 0.0 /100 | #336 | Tragic 7.7% |
| Cheyenne | 0.0 /100 | #337 | Tragic 8.0% |
| Pima | 0.0 /100 | #338 | Tragic 8.2% |
| Navajo | 0.0 /100 | #339 | Tragic 8.4% |
| Puerto Ricans | 0.0 /100 | #340 | Tragic 8.4% |
| Tohono O'odham | 0.0 /100 | #341 | Tragic 8.9% |
| Hopi | 0.0 /100 | #342 | Tragic 8.9% |
| Yuman | 0.0 /100 | #343 | Tragic 9.1% |
Demographics Similar to Immigrants from Guatemala by Unemployment
In terms of unemployment, the demographic groups most similar to Immigrants from Guatemala are Immigrants from Uzbekistan (5.8%, a difference of 0.020%), Subsaharan African (5.8%, a difference of 0.040%), Sierra Leonean (5.8%, a difference of 0.10%), Salvadoran (5.8%, a difference of 0.13%), and Immigrants from Bahamas (5.8%, a difference of 0.16%).
| Demographics | Rating | Rank | Unemployment |
| Immigrants | Honduras | 0.3 /100 | #254 | Tragic 5.7% |
| Immigrants | Portugal | 0.2 /100 | #255 | Tragic 5.7% |
| Guatemalans | 0.2 /100 | #256 | Tragic 5.8% |
| Yaqui | 0.2 /100 | #257 | Tragic 5.8% |
| Immigrants | Bahamas | 0.1 /100 | #258 | Tragic 5.8% |
| Sub-Saharan Africans | 0.1 /100 | #259 | Tragic 5.8% |
| Immigrants | Uzbekistan | 0.1 /100 | #260 | Tragic 5.8% |
| Immigrants | Guatemala | 0.1 /100 | #261 | Tragic 5.8% |
| Sierra Leoneans | 0.1 /100 | #262 | Tragic 5.8% |
| Salvadorans | 0.1 /100 | #263 | Tragic 5.8% |
| Immigrants | Liberia | 0.1 /100 | #264 | Tragic 5.8% |
| Nigerians | 0.1 /100 | #265 | Tragic 5.8% |
| Mexican American Indians | 0.1 /100 | #266 | Tragic 5.8% |
| Immigrants | Nigeria | 0.1 /100 | #267 | Tragic 5.8% |
| Immigrants | Sierra Leone | 0.1 /100 | #268 | Tragic 5.8% |