Immigrants from Western Europe vs Cypriot Unemployment Among Ages 45 to 54 years
COMPARE
Immigrants from Western Europe
Cypriot
Unemployment Among Ages 45 to 54 years
Unemployment Among Ages 45 to 54 years Comparison
Immigrants from Western Europe
Cypriots
4.5%
UNEMPLOYMENT AMONG AGES 45 TO 54 YEARS
57.4/ 100
METRIC RATING
166th/ 347
METRIC RANK
4.5%
UNEMPLOYMENT AMONG AGES 45 TO 54 YEARS
74.4/ 100
METRIC RATING
151st/ 347
METRIC RANK
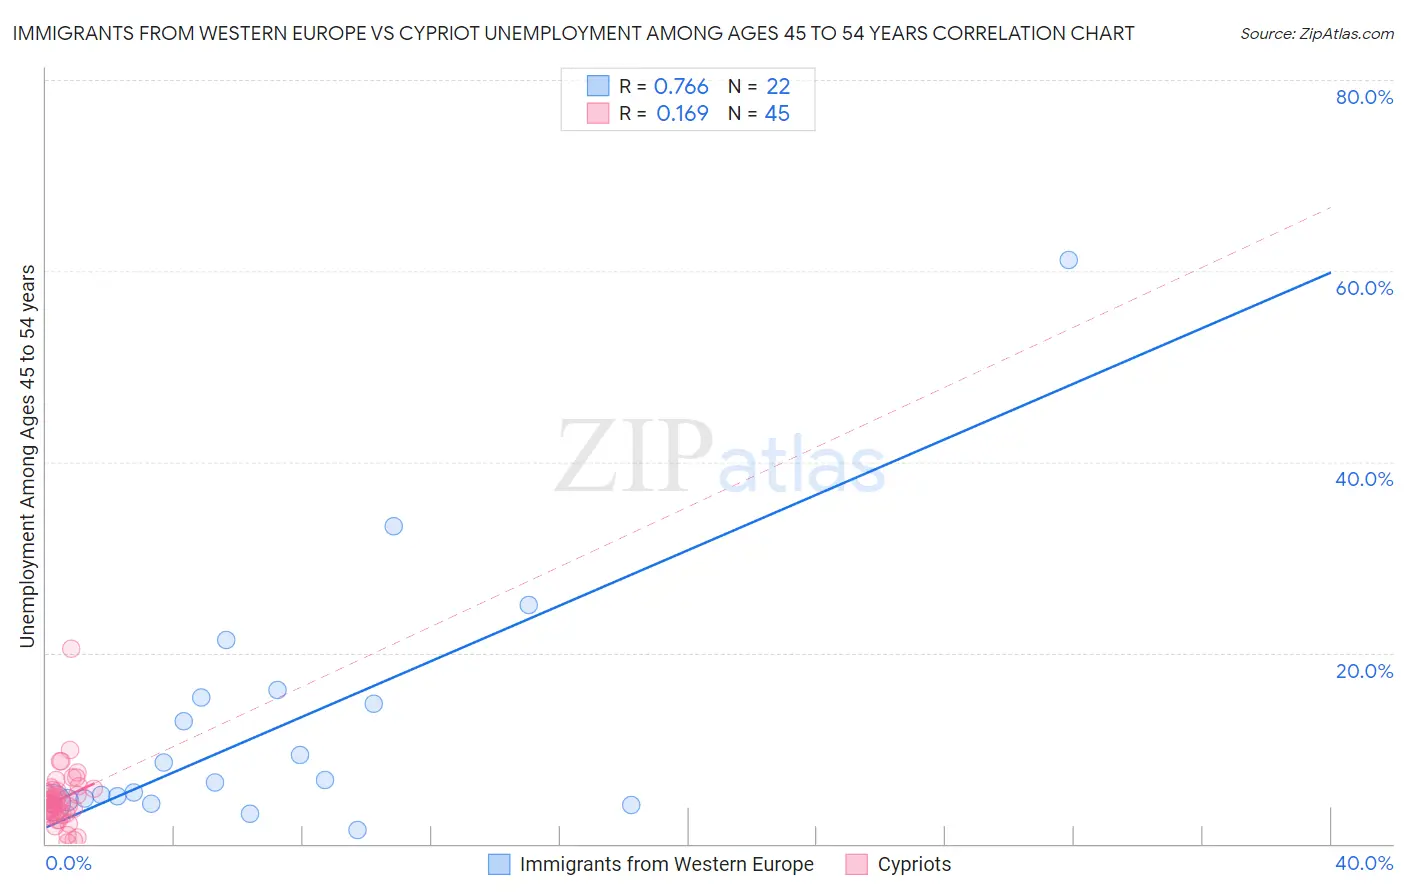
Immigrants from Western Europe vs Cypriot Unemployment Among Ages 45 to 54 years Correlation Chart
The statistical analysis conducted on geographies consisting of 473,073,431 people shows a strong positive correlation between the proportion of Immigrants from Western Europe and unemployment rate among population between the ages 45 and 54 in the United States with a correlation coefficient (R) of 0.766 and weighted average of 4.5%. Similarly, the statistical analysis conducted on geographies consisting of 61,639,842 people shows a poor positive correlation between the proportion of Cypriots and unemployment rate among population between the ages 45 and 54 in the United States with a correlation coefficient (R) of 0.169 and weighted average of 4.5%, a difference of 0.91%.
Unemployment Among Ages 45 to 54 years Correlation Summary
| Measurement | Immigrants from Western Europe | Cypriot |
| Minimum | 1.5% | 0.10% |
| Maximum | 61.1% | 20.4% |
| Range | 59.6% | 20.3% |
| Mean | 12.4% | 4.7% |
| Median | 6.5% | 4.2% |
| Interquartile 25% (IQ1) | 4.5% | 3.1% |
| Interquartile 75% (IQ3) | 15.3% | 5.7% |
| Interquartile Range (IQR) | 10.8% | 2.6% |
| Standard Deviation (Sample) | 13.6% | 3.2% |
| Standard Deviation (Population) | 13.2% | 3.2% |
Demographics Similar to Immigrants from Western Europe and Cypriots by Unemployment Among Ages 45 to 54 years
In terms of unemployment among ages 45 to 54 years, the demographic groups most similar to Immigrants from Western Europe are Maltese (4.5%, a difference of 0.020%), Samoan (4.5%, a difference of 0.050%), Immigrants from Brazil (4.5%, a difference of 0.050%), Bangladeshi (4.5%, a difference of 0.11%), and Immigrants from Europe (4.5%, a difference of 0.13%). Similarly, the demographic groups most similar to Cypriots are Tsimshian (4.5%, a difference of 0.010%), Immigrants from Austria (4.5%, a difference of 0.060%), Costa Rican (4.5%, a difference of 0.060%), Korean (4.5%, a difference of 0.080%), and Hungarian (4.5%, a difference of 0.090%).
| Demographics | Rating | Rank | Unemployment Among Ages 45 to 54 years |
| Immigrants | Austria | 75.3 /100 | #148 | Good 4.5% |
| Costa Ricans | 75.3 /100 | #149 | Good 4.5% |
| Tsimshian | 74.6 /100 | #150 | Good 4.5% |
| Cypriots | 74.4 /100 | #151 | Good 4.5% |
| Koreans | 73.1 /100 | #152 | Good 4.5% |
| Hungarians | 73.0 /100 | #153 | Good 4.5% |
| Immigrants | Spain | 72.5 /100 | #154 | Good 4.5% |
| Marshallese | 70.6 /100 | #155 | Good 4.5% |
| Immigrants | Croatia | 69.6 /100 | #156 | Good 4.5% |
| Indians (Asian) | 68.1 /100 | #157 | Good 4.5% |
| Immigrants | Italy | 65.5 /100 | #158 | Good 4.5% |
| Immigrants | Nonimmigrants | 62.8 /100 | #159 | Good 4.5% |
| Immigrants | South Eastern Asia | 62.0 /100 | #160 | Good 4.5% |
| Immigrants | Eastern Europe | 61.6 /100 | #161 | Good 4.5% |
| Immigrants | Indonesia | 60.3 /100 | #162 | Good 4.5% |
| Bangladeshis | 59.7 /100 | #163 | Average 4.5% |
| Samoans | 58.5 /100 | #164 | Average 4.5% |
| Maltese | 57.9 /100 | #165 | Average 4.5% |
| Immigrants | Western Europe | 57.4 /100 | #166 | Average 4.5% |
| Immigrants | Brazil | 56.4 /100 | #167 | Average 4.5% |
| Immigrants | Europe | 54.7 /100 | #168 | Average 4.5% |