Egyptian vs Cypriot Unemployment Among Ages 45 to 54 years
COMPARE
Egyptian
Cypriot
Unemployment Among Ages 45 to 54 years
Unemployment Among Ages 45 to 54 years Comparison
Egyptians
Cypriots
4.5%
UNEMPLOYMENT AMONG AGES 45 TO 54 YEARS
53.6/ 100
METRIC RATING
171st/ 347
METRIC RANK
4.5%
UNEMPLOYMENT AMONG AGES 45 TO 54 YEARS
74.4/ 100
METRIC RATING
151st/ 347
METRIC RANK
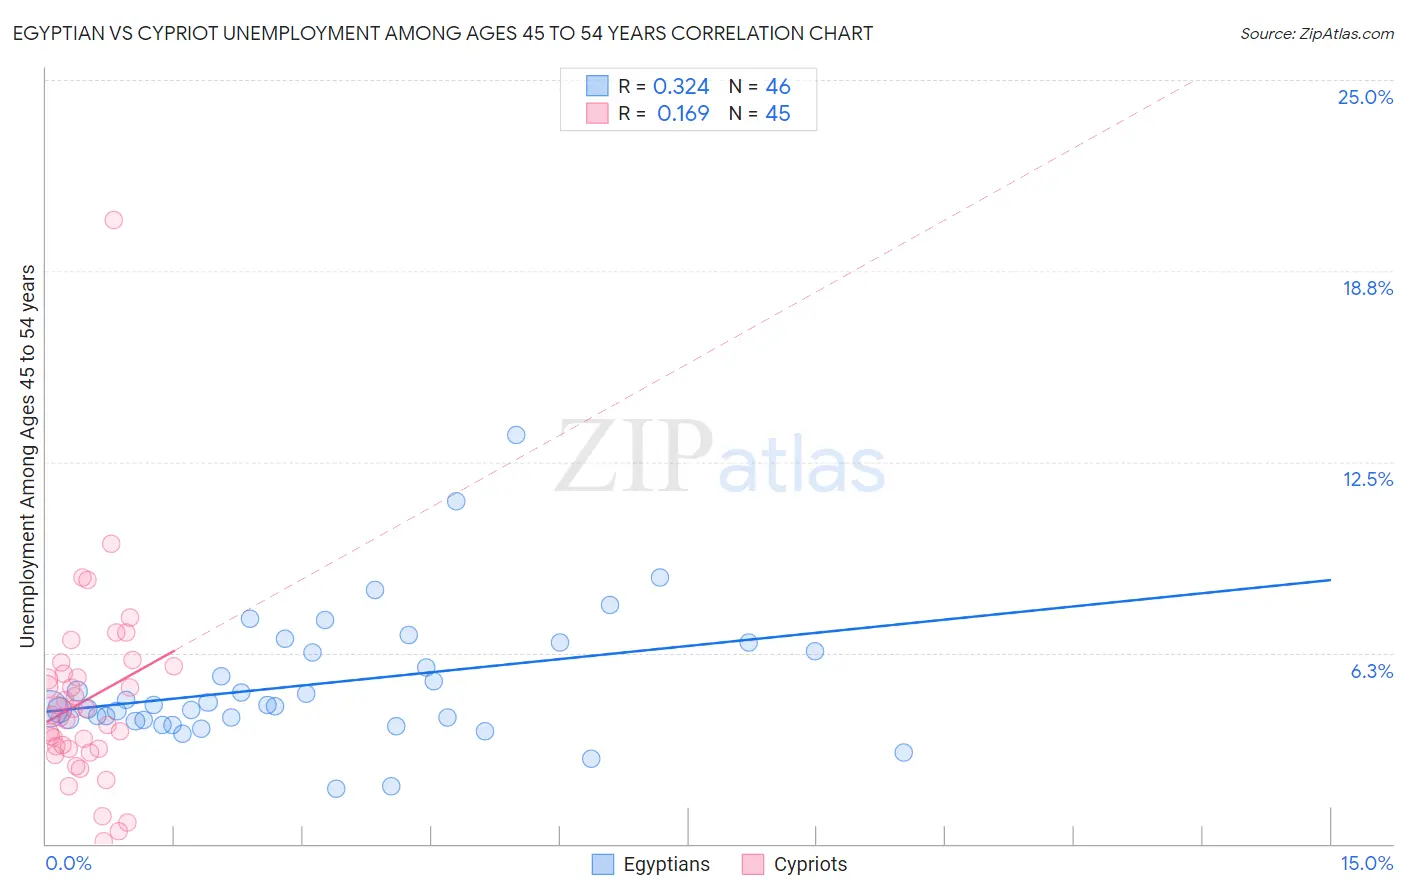
Egyptian vs Cypriot Unemployment Among Ages 45 to 54 years Correlation Chart
The statistical analysis conducted on geographies consisting of 272,921,449 people shows a mild positive correlation between the proportion of Egyptians and unemployment rate among population between the ages 45 and 54 in the United States with a correlation coefficient (R) of 0.324 and weighted average of 4.5%. Similarly, the statistical analysis conducted on geographies consisting of 61,639,842 people shows a poor positive correlation between the proportion of Cypriots and unemployment rate among population between the ages 45 and 54 in the United States with a correlation coefficient (R) of 0.169 and weighted average of 4.5%, a difference of 1.1%.
Unemployment Among Ages 45 to 54 years Correlation Summary
| Measurement | Egyptian | Cypriot |
| Minimum | 1.8% | 0.10% |
| Maximum | 13.4% | 20.4% |
| Range | 11.6% | 20.3% |
| Mean | 5.2% | 4.7% |
| Median | 4.5% | 4.2% |
| Interquartile 25% (IQ1) | 4.1% | 3.1% |
| Interquartile 75% (IQ3) | 6.3% | 5.7% |
| Interquartile Range (IQR) | 2.2% | 2.6% |
| Standard Deviation (Sample) | 2.2% | 3.2% |
| Standard Deviation (Population) | 2.1% | 3.2% |
Demographics Similar to Egyptians and Cypriots by Unemployment Among Ages 45 to 54 years
In terms of unemployment among ages 45 to 54 years, the demographic groups most similar to Egyptians are Spaniard (4.5%, a difference of 0.030%), Immigrants from Europe (4.5%, a difference of 0.050%), Immigrants from Egypt (4.5%, a difference of 0.050%), Immigrants from Brazil (4.5%, a difference of 0.13%), and Immigrants from Western Europe (4.5%, a difference of 0.18%). Similarly, the demographic groups most similar to Cypriots are Korean (4.5%, a difference of 0.080%), Hungarian (4.5%, a difference of 0.090%), Immigrants from Spain (4.5%, a difference of 0.12%), Marshallese (4.5%, a difference of 0.22%), and Immigrants from Croatia (4.5%, a difference of 0.28%).
| Demographics | Rating | Rank | Unemployment Among Ages 45 to 54 years |
| Cypriots | 74.4 /100 | #151 | Good 4.5% |
| Koreans | 73.1 /100 | #152 | Good 4.5% |
| Hungarians | 73.0 /100 | #153 | Good 4.5% |
| Immigrants | Spain | 72.5 /100 | #154 | Good 4.5% |
| Marshallese | 70.6 /100 | #155 | Good 4.5% |
| Immigrants | Croatia | 69.6 /100 | #156 | Good 4.5% |
| Indians (Asian) | 68.1 /100 | #157 | Good 4.5% |
| Immigrants | Italy | 65.5 /100 | #158 | Good 4.5% |
| Immigrants | Nonimmigrants | 62.8 /100 | #159 | Good 4.5% |
| Immigrants | South Eastern Asia | 62.0 /100 | #160 | Good 4.5% |
| Immigrants | Eastern Europe | 61.6 /100 | #161 | Good 4.5% |
| Immigrants | Indonesia | 60.3 /100 | #162 | Good 4.5% |
| Bangladeshis | 59.7 /100 | #163 | Average 4.5% |
| Samoans | 58.5 /100 | #164 | Average 4.5% |
| Maltese | 57.9 /100 | #165 | Average 4.5% |
| Immigrants | Western Europe | 57.4 /100 | #166 | Average 4.5% |
| Immigrants | Brazil | 56.4 /100 | #167 | Average 4.5% |
| Immigrants | Europe | 54.7 /100 | #168 | Average 4.5% |
| Immigrants | Egypt | 54.7 /100 | #169 | Average 4.5% |
| Spaniards | 54.3 /100 | #170 | Average 4.5% |
| Egyptians | 53.6 /100 | #171 | Average 4.5% |