Immigrants from Western Asia vs Immigrants from Congo Unemployment Among Ages 60 to 64 years
COMPARE
Immigrants from Western Asia
Immigrants from Congo
Unemployment Among Ages 60 to 64 years
Unemployment Among Ages 60 to 64 years Comparison
Immigrants from Western Asia
Immigrants from Congo
5.0%
UNEMPLOYMENT AMONG AGES 60 TO 64 YEARS
3.0/ 100
METRIC RATING
237th/ 347
METRIC RANK
4.1%
UNEMPLOYMENT AMONG AGES 60 TO 64 YEARS
100.0/ 100
METRIC RATING
6th/ 347
METRIC RANK
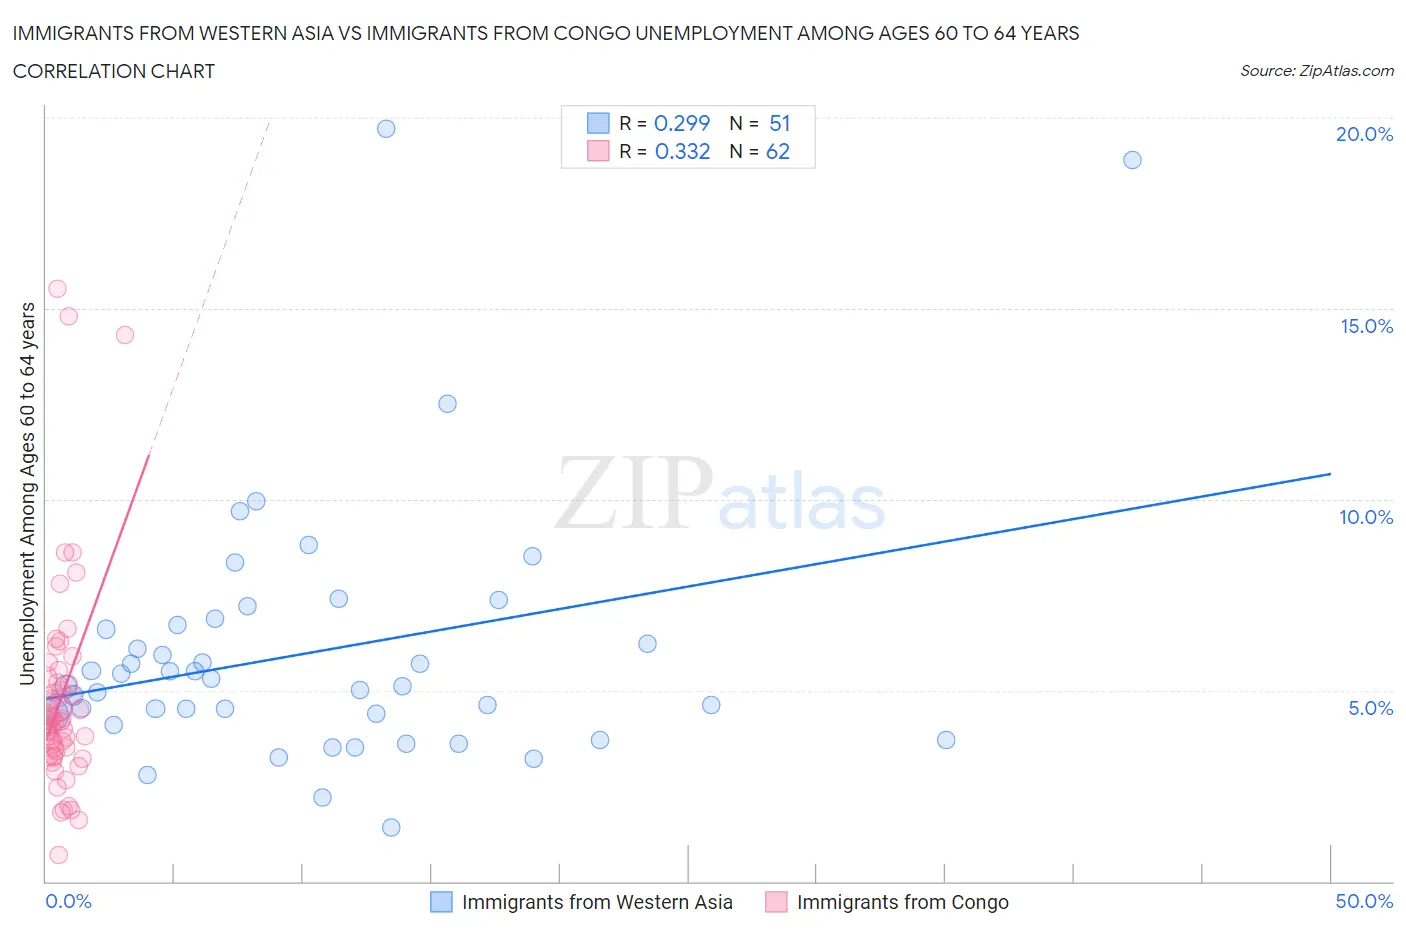
Immigrants from Western Asia vs Immigrants from Congo Unemployment Among Ages 60 to 64 years Correlation Chart
The statistical analysis conducted on geographies consisting of 369,047,156 people shows a weak positive correlation between the proportion of Immigrants from Western Asia and unemployment rate among population between the ages 60 and 64 in the United States with a correlation coefficient (R) of 0.299 and weighted average of 5.0%. Similarly, the statistical analysis conducted on geographies consisting of 89,429,972 people shows a mild positive correlation between the proportion of Immigrants from Congo and unemployment rate among population between the ages 60 and 64 in the United States with a correlation coefficient (R) of 0.332 and weighted average of 4.1%, a difference of 21.3%.
Unemployment Among Ages 60 to 64 years Correlation Summary
| Measurement | Immigrants from Western Asia | Immigrants from Congo |
| Minimum | 1.4% | 0.70% |
| Maximum | 19.7% | 15.5% |
| Range | 18.3% | 14.8% |
| Mean | 6.0% | 4.8% |
| Median | 5.1% | 4.2% |
| Interquartile 25% (IQ1) | 4.3% | 3.4% |
| Interquartile 75% (IQ3) | 6.7% | 5.2% |
| Interquartile Range (IQR) | 2.4% | 1.8% |
| Standard Deviation (Sample) | 3.4% | 2.8% |
| Standard Deviation (Population) | 3.4% | 2.8% |
Similar Demographics by Unemployment Among Ages 60 to 64 years
Demographics Similar to Immigrants from Western Asia by Unemployment Among Ages 60 to 64 years
In terms of unemployment among ages 60 to 64 years, the demographic groups most similar to Immigrants from Western Asia are Immigrants from Poland (5.0%, a difference of 0.0%), Immigrants from Sierra Leone (5.0%, a difference of 0.040%), Delaware (5.0%, a difference of 0.17%), Ghanaian (5.0%, a difference of 0.18%), and Immigrants from Croatia (5.0%, a difference of 0.25%).
| Demographics | Rating | Rank | Unemployment Among Ages 60 to 64 years |
| Immigrants | Denmark | 5.8 /100 | #230 | Tragic 5.0% |
| Tohono O'odham | 5.7 /100 | #231 | Tragic 5.0% |
| Immigrants | Eastern Asia | 4.7 /100 | #232 | Tragic 5.0% |
| Immigrants | Greece | 4.6 /100 | #233 | Tragic 5.0% |
| Iranians | 4.2 /100 | #234 | Tragic 5.0% |
| Delaware | 3.6 /100 | #235 | Tragic 5.0% |
| Immigrants | Sierra Leone | 3.1 /100 | #236 | Tragic 5.0% |
| Immigrants | Western Asia | 3.0 /100 | #237 | Tragic 5.0% |
| Immigrants | Poland | 3.0 /100 | #238 | Tragic 5.0% |
| Ghanaians | 2.4 /100 | #239 | Tragic 5.0% |
| Immigrants | Croatia | 2.2 /100 | #240 | Tragic 5.0% |
| Indians (Asian) | 2.2 /100 | #241 | Tragic 5.0% |
| Argentineans | 2.1 /100 | #242 | Tragic 5.0% |
| Immigrants | Philippines | 1.9 /100 | #243 | Tragic 5.0% |
| Peruvians | 1.6 /100 | #244 | Tragic 5.0% |
Demographics Similar to Immigrants from Congo by Unemployment Among Ages 60 to 64 years
In terms of unemployment among ages 60 to 64 years, the demographic groups most similar to Immigrants from Congo are Lumbee (4.2%, a difference of 0.91%), Immigrants from Micronesia (4.2%, a difference of 2.1%), Indonesian (4.2%, a difference of 2.6%), Immigrants from the Azores (4.0%, a difference of 2.7%), and Hmong (4.0%, a difference of 2.7%).
| Demographics | Rating | Rank | Unemployment Among Ages 60 to 64 years |
| Marshallese | 100.0 /100 | #1 | Exceptional 3.7% |
| Fijians | 100.0 /100 | #2 | Exceptional 3.9% |
| Chinese | 100.0 /100 | #3 | Exceptional 4.0% |
| Hmong | 100.0 /100 | #4 | Exceptional 4.0% |
| Immigrants | Azores | 100.0 /100 | #5 | Exceptional 4.0% |
| Immigrants | Congo | 100.0 /100 | #6 | Exceptional 4.1% |
| Lumbee | 100.0 /100 | #7 | Exceptional 4.2% |
| Immigrants | Micronesia | 100.0 /100 | #8 | Exceptional 4.2% |
| Indonesians | 100.0 /100 | #9 | Exceptional 4.2% |
| Immigrants | Bosnia and Herzegovina | 100.0 /100 | #10 | Exceptional 4.2% |
| Luxembourgers | 100.0 /100 | #11 | Exceptional 4.3% |
| Immigrants | Cuba | 100.0 /100 | #12 | Exceptional 4.3% |
| Chickasaw | 100.0 /100 | #13 | Exceptional 4.3% |
| Norwegians | 100.0 /100 | #14 | Exceptional 4.3% |
| Sudanese | 100.0 /100 | #15 | Exceptional 4.3% |