Immigrants from Western Asia vs Apache Unemployment Among Ages 60 to 64 years
COMPARE
Immigrants from Western Asia
Apache
Unemployment Among Ages 60 to 64 years
Unemployment Among Ages 60 to 64 years Comparison
Immigrants from Western Asia
Apache
5.0%
UNEMPLOYMENT AMONG AGES 60 TO 64 YEARS
3.0/ 100
METRIC RATING
237th/ 347
METRIC RANK
6.0%
UNEMPLOYMENT AMONG AGES 60 TO 64 YEARS
0.0/ 100
METRIC RATING
328th/ 347
METRIC RANK
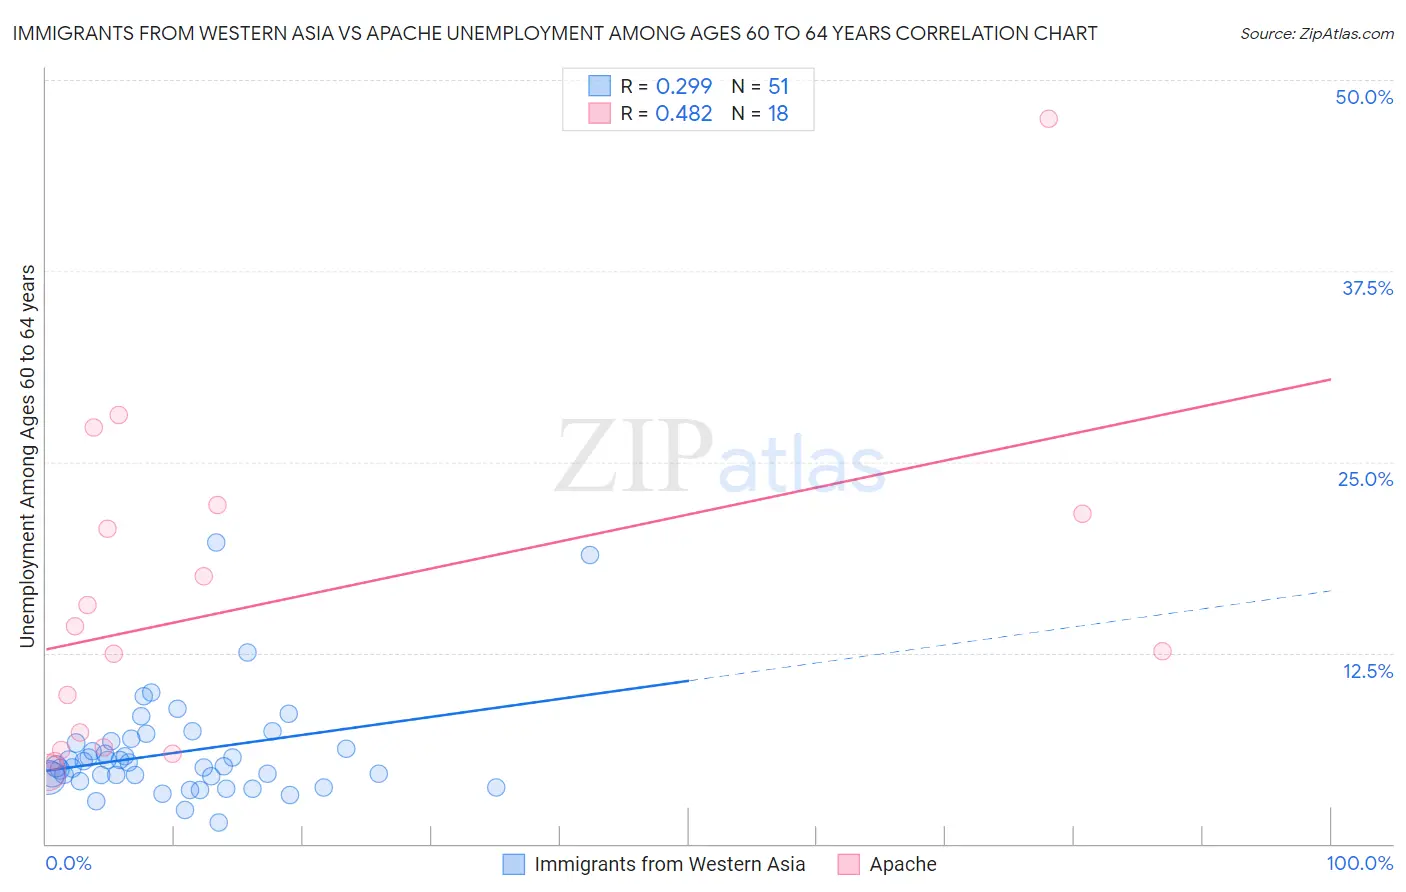
Immigrants from Western Asia vs Apache Unemployment Among Ages 60 to 64 years Correlation Chart
The statistical analysis conducted on geographies consisting of 369,047,156 people shows a weak positive correlation between the proportion of Immigrants from Western Asia and unemployment rate among population between the ages 60 and 64 in the United States with a correlation coefficient (R) of 0.299 and weighted average of 5.0%. Similarly, the statistical analysis conducted on geographies consisting of 214,919,581 people shows a moderate positive correlation between the proportion of Apache and unemployment rate among population between the ages 60 and 64 in the United States with a correlation coefficient (R) of 0.482 and weighted average of 6.0%, a difference of 18.9%.
Unemployment Among Ages 60 to 64 years Correlation Summary
| Measurement | Immigrants from Western Asia | Apache |
| Minimum | 1.4% | 4.6% |
| Maximum | 19.7% | 47.5% |
| Range | 18.3% | 42.9% |
| Mean | 6.0% | 15.8% |
| Median | 5.1% | 13.4% |
| Interquartile 25% (IQ1) | 4.3% | 6.3% |
| Interquartile 75% (IQ3) | 6.7% | 21.6% |
| Interquartile Range (IQR) | 2.4% | 15.3% |
| Standard Deviation (Sample) | 3.4% | 10.9% |
| Standard Deviation (Population) | 3.4% | 10.6% |
Similar Demographics by Unemployment Among Ages 60 to 64 years
Demographics Similar to Immigrants from Western Asia by Unemployment Among Ages 60 to 64 years
In terms of unemployment among ages 60 to 64 years, the demographic groups most similar to Immigrants from Western Asia are Immigrants from Poland (5.0%, a difference of 0.0%), Immigrants from Sierra Leone (5.0%, a difference of 0.040%), Delaware (5.0%, a difference of 0.17%), Ghanaian (5.0%, a difference of 0.18%), and Immigrants from Croatia (5.0%, a difference of 0.25%).
| Demographics | Rating | Rank | Unemployment Among Ages 60 to 64 years |
| Immigrants | Denmark | 5.8 /100 | #230 | Tragic 5.0% |
| Tohono O'odham | 5.7 /100 | #231 | Tragic 5.0% |
| Immigrants | Eastern Asia | 4.7 /100 | #232 | Tragic 5.0% |
| Immigrants | Greece | 4.6 /100 | #233 | Tragic 5.0% |
| Iranians | 4.2 /100 | #234 | Tragic 5.0% |
| Delaware | 3.6 /100 | #235 | Tragic 5.0% |
| Immigrants | Sierra Leone | 3.1 /100 | #236 | Tragic 5.0% |
| Immigrants | Western Asia | 3.0 /100 | #237 | Tragic 5.0% |
| Immigrants | Poland | 3.0 /100 | #238 | Tragic 5.0% |
| Ghanaians | 2.4 /100 | #239 | Tragic 5.0% |
| Immigrants | Croatia | 2.2 /100 | #240 | Tragic 5.0% |
| Indians (Asian) | 2.2 /100 | #241 | Tragic 5.0% |
| Argentineans | 2.1 /100 | #242 | Tragic 5.0% |
| Immigrants | Philippines | 1.9 /100 | #243 | Tragic 5.0% |
| Peruvians | 1.6 /100 | #244 | Tragic 5.0% |
Demographics Similar to Apache by Unemployment Among Ages 60 to 64 years
In terms of unemployment among ages 60 to 64 years, the demographic groups most similar to Apache are Immigrants from Bangladesh (6.0%, a difference of 0.010%), Immigrants from Armenia (6.0%, a difference of 0.27%), Yakama (6.0%, a difference of 0.40%), Dominican (6.0%, a difference of 0.43%), and Immigrants from Dominican Republic (6.0%, a difference of 0.78%).
| Demographics | Rating | Rank | Unemployment Among Ages 60 to 64 years |
| Dutch West Indians | 0.0 /100 | #321 | Tragic 5.7% |
| Ecuadorians | 0.0 /100 | #322 | Tragic 5.8% |
| Alsatians | 0.0 /100 | #323 | Tragic 5.8% |
| Immigrants | Ecuador | 0.0 /100 | #324 | Tragic 5.8% |
| Paiute | 0.0 /100 | #325 | Tragic 5.8% |
| Immigrants | St. Vincent and the Grenadines | 0.0 /100 | #326 | Tragic 5.9% |
| Immigrants | Grenada | 0.0 /100 | #327 | Tragic 5.9% |
| Apache | 0.0 /100 | #328 | Tragic 6.0% |
| Immigrants | Bangladesh | 0.0 /100 | #329 | Tragic 6.0% |
| Immigrants | Armenia | 0.0 /100 | #330 | Tragic 6.0% |
| Yakama | 0.0 /100 | #331 | Tragic 6.0% |
| Dominicans | 0.0 /100 | #332 | Tragic 6.0% |
| Immigrants | Dominican Republic | 0.0 /100 | #333 | Tragic 6.0% |
| Puerto Ricans | 0.0 /100 | #334 | Tragic 6.1% |
| Vietnamese | 0.0 /100 | #335 | Tragic 6.1% |