Immigrants from Western Africa vs Immigrants from Ghana Unemployment Among Ages 65 to 74 years
COMPARE
Immigrants from Western Africa
Immigrants from Ghana
Unemployment Among Ages 65 to 74 years
Unemployment Among Ages 65 to 74 years Comparison
Immigrants from Western Africa
Immigrants from Ghana
5.6%
UNEMPLOYMENT AMONG AGES 65 TO 74 YEARS
0.3/ 100
METRIC RATING
258th/ 347
METRIC RANK
5.6%
UNEMPLOYMENT AMONG AGES 65 TO 74 YEARS
1.4/ 100
METRIC RATING
242nd/ 347
METRIC RANK
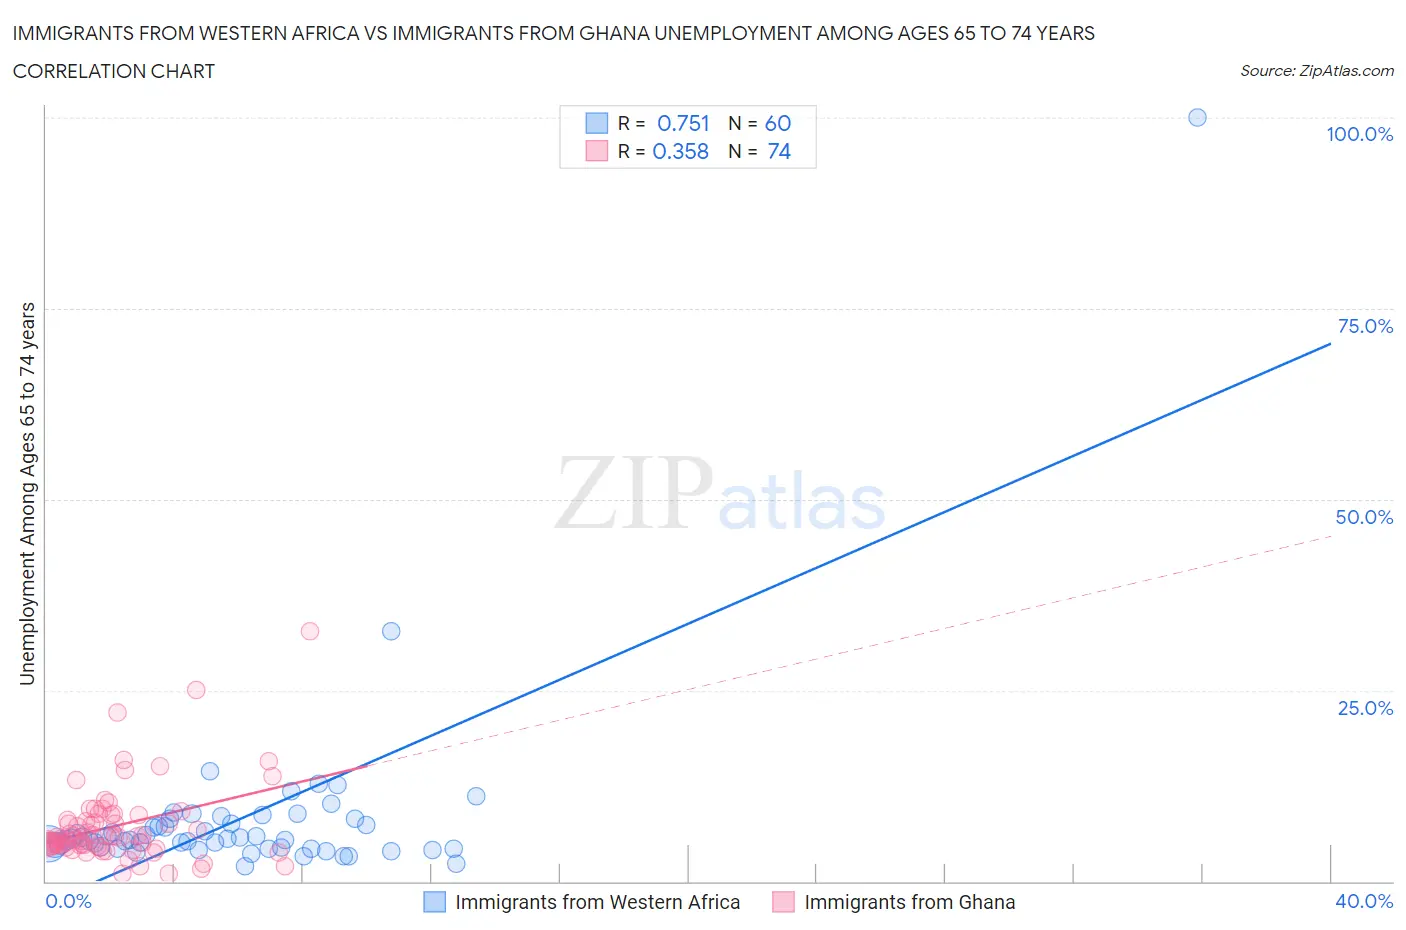
Immigrants from Western Africa vs Immigrants from Ghana Unemployment Among Ages 65 to 74 years Correlation Chart
The statistical analysis conducted on geographies consisting of 321,582,029 people shows a strong positive correlation between the proportion of Immigrants from Western Africa and unemployment rate among population between the ages 65 and 74 in the United States with a correlation coefficient (R) of 0.751 and weighted average of 5.6%. Similarly, the statistical analysis conducted on geographies consisting of 186,857,446 people shows a mild positive correlation between the proportion of Immigrants from Ghana and unemployment rate among population between the ages 65 and 74 in the United States with a correlation coefficient (R) of 0.358 and weighted average of 5.6%, a difference of 1.4%.
Unemployment Among Ages 65 to 74 years Correlation Summary
| Measurement | Immigrants from Western Africa | Immigrants from Ghana |
| Minimum | 2.0% | 1.0% |
| Maximum | 100.0% | 32.7% |
| Range | 98.0% | 31.7% |
| Mean | 8.2% | 7.3% |
| Median | 5.5% | 5.8% |
| Interquartile 25% (IQ1) | 4.4% | 4.7% |
| Interquartile 75% (IQ3) | 7.9% | 8.6% |
| Interquartile Range (IQR) | 3.5% | 3.9% |
| Standard Deviation (Sample) | 12.8% | 5.2% |
| Standard Deviation (Population) | 12.7% | 5.2% |
Demographics Similar to Immigrants from Western Africa and Immigrants from Ghana by Unemployment Among Ages 65 to 74 years
In terms of unemployment among ages 65 to 74 years, the demographic groups most similar to Immigrants from Western Africa are Sierra Leonean (5.6%, a difference of 0.070%), Immigrants from Barbados (5.6%, a difference of 0.10%), Immigrants from Southern Europe (5.6%, a difference of 0.16%), Native Hawaiian (5.6%, a difference of 0.28%), and Immigrants from Haiti (5.6%, a difference of 0.38%). Similarly, the demographic groups most similar to Immigrants from Ghana are Cree (5.6%, a difference of 0.0%), Ghanaian (5.6%, a difference of 0.040%), Immigrants from Peru (5.6%, a difference of 0.060%), Immigrants from Micronesia (5.6%, a difference of 0.33%), and Immigrants from Greece (5.6%, a difference of 0.33%).
| Demographics | Rating | Rank | Unemployment Among Ages 65 to 74 years |
| Ghanaians | 1.4 /100 | #240 | Tragic 5.6% |
| Cree | 1.4 /100 | #241 | Tragic 5.6% |
| Immigrants | Ghana | 1.4 /100 | #242 | Tragic 5.6% |
| Immigrants | Peru | 1.3 /100 | #243 | Tragic 5.6% |
| Immigrants | Micronesia | 0.9 /100 | #244 | Tragic 5.6% |
| Immigrants | Greece | 0.9 /100 | #245 | Tragic 5.6% |
| Paraguayans | 0.9 /100 | #246 | Tragic 5.6% |
| Immigrants | Immigrants | 0.9 /100 | #247 | Tragic 5.6% |
| Immigrants | Argentina | 0.9 /100 | #248 | Tragic 5.6% |
| Trinidadians and Tobagonians | 0.8 /100 | #249 | Tragic 5.6% |
| Cape Verdeans | 0.7 /100 | #250 | Tragic 5.6% |
| Brazilians | 0.5 /100 | #251 | Tragic 5.6% |
| Colombians | 0.5 /100 | #252 | Tragic 5.6% |
| Immigrants | Brazil | 0.5 /100 | #253 | Tragic 5.6% |
| Immigrants | Costa Rica | 0.5 /100 | #254 | Tragic 5.6% |
| Immigrants | Haiti | 0.4 /100 | #255 | Tragic 5.6% |
| Native Hawaiians | 0.4 /100 | #256 | Tragic 5.6% |
| Immigrants | Southern Europe | 0.3 /100 | #257 | Tragic 5.6% |
| Immigrants | Western Africa | 0.3 /100 | #258 | Tragic 5.6% |
| Sierra Leoneans | 0.2 /100 | #259 | Tragic 5.6% |
| Immigrants | Barbados | 0.2 /100 | #260 | Tragic 5.6% |