Immigrants from Western Africa vs Immigrants from Bulgaria Unemployment Among Ages 65 to 74 years

COMPARE

Immigrants from Western Africa
Race
Ancestry
AfghanAfricanAlaska NativeAlaskan AthabascanAlbanianAleutAlsatianAmericanApacheArabArapahoArgentineanArmenianAssyrian/Chaldean/SyriacAustralianAustrianBahamianBangladeshiBarbadianBasqueBelgianBelizeanBermudanBhutaneseBlackfeetBolivianBrazilianBritishBritish West IndianBulgarianBurmeseCajunCambodianCanadianCape VerdeanCarpatho RusynCelticCentral AmericanCentral American IndianCherokeeCheyenneChickasawChileanChineseChippewaChoctawColombianColvilleComancheCosta RicanCreeCreekCroatianCrowCubanCypriotCzechCzechoslovakianDanishDelawareDominicanDutchDutch West IndianEastern EuropeanEcuadorianEgyptianEnglishEstonianEthiopianEuropeanFijianFilipinoFinnishFrenchFrench American IndianFrench CanadianGermanGerman RussianGhanaianGreekGuamanian/ChamorroGuatemalanGuyaneseHaitianHmongHonduranHopiHoumaHungarianIcelanderIndian (Asian)IndonesianInupiatIranianIraqiIrishIroquoisIsraeliItalianJamaicanJapaneseJordanianKenyanKiowaKoreanLaotianLatvianLebaneseLiberianLithuanianLumbeeLuxembourgerMacedonianMalaysianMalteseMarshalleseMenomineeMexicanMexican American IndianMongolianMoroccanNative HawaiianNavajoNepaleseNew ZealanderNicaraguanNigerianNorthern EuropeanNorwegianOkinawanOsageOttawaPaiutePakistaniPalestinianPanamanianParaguayanPennsylvania GermanPeruvianPimaPolishPortuguesePotawatomiPuebloPuerto RicanPuget Sound SalishRomanianRussianSalvadoranSamoanScandinavianScotch-IrishScottishSeminoleSenegaleseSerbianShoshoneSierra LeoneanSiouxSlavicSlovakSloveneSomaliSouth AfricanSouth AmericanSouth American IndianSoviet UnionSpaniardSpanishSpanish AmericanSpanish American IndianSri LankanSubsaharan AfricanSudaneseSwedishSwissSyrianTaiwaneseThaiTlingit-HaidaTohono O'OdhamTonganTrinidadian and TobagonianTsimshianTurkishU.S. Virgin IslanderUgandanUkrainianUruguayanUteVenezuelanVietnameseWelshWest IndianYakamaYaquiYugoslavianYumanYup'ikZimbabwean
Immigration
NonimmigrantsImmigrantsAfghanistanAfricaAlbaniaArgentinaArmeniaAsiaAustraliaAustriaBahamasBangladeshBarbadosBelarusBelgiumBelizeBoliviaBosnia and HerzegovinaBrazilBurma/MyanmarCabo VerdeCambodiaCameroonCanadaCaribbeanCentral AmericaChileChinaColombiaCongoCosta RicaCroatiaCubaCzechoslovakiaDenmarkDominicaDominican RepublicEastern AfricaEastern AsiaEastern EuropeEcuadorEgyptEl SalvadorEnglandEritreaEthiopiaEuropeFijiFranceGermanyGhanaGreeceGrenadaGuatemalaGuyanaHaitiHondurasHong KongHungaryIndiaIndonesiaIranIraqIrelandIsraelItalyJamaicaJapanJordanKazakhstanKenyaKoreaKuwaitLaosLatin AmericaLatviaLebanonLiberiaLithuaniaMalaysiaMexicoMicronesiaMiddle AfricaMoldovaMoroccoNepalNetherlandsNicaraguaNigeriaNorth AmericaNorth MacedoniaNorthern AfricaNorthern EuropeNorwayOceaniaPakistanPanamaPeruPhilippinesPolandPortugalRomaniaRussiaSaudi ArabiaScotlandSenegalSerbiaSierra LeoneSingaporeSomaliaSouth AfricaSouth AmericaSouth Central AsiaSouth Eastern AsiaSouthern EuropeSpainSri LankaSt. Vincent and the GrenadinesSudanSwedenSwitzerlandSyriaTaiwanThailandTrinidad and TobagoTurkeyUgandaUkraineUruguayUzbekistanVenezuelaVietnamWest IndiesWestern AfricaWestern AsiaWestern EuropeYemenZaireZimbabweAzores
Immigrants from Bulgaria
Race
Ancestry
AfghanAfricanAlaska NativeAlaskan AthabascanAlbanianAleutAlsatianAmericanApacheArabArapahoArgentineanArmenianAssyrian/Chaldean/SyriacAustralianAustrianBahamianBangladeshiBarbadianBasqueBelgianBelizeanBermudanBhutaneseBlackfeetBolivianBrazilianBritishBritish West IndianBulgarianBurmeseCajunCambodianCanadianCape VerdeanCarpatho RusynCelticCentral AmericanCentral American IndianCherokeeCheyenneChickasawChileanChineseChippewaChoctawColombianColvilleComancheCosta RicanCreeCreekCroatianCrowCubanCypriotCzechCzechoslovakianDanishDelawareDominicanDutchDutch West IndianEastern EuropeanEcuadorianEgyptianEnglishEstonianEthiopianEuropeanFijianFilipinoFinnishFrenchFrench American IndianFrench CanadianGermanGerman RussianGhanaianGreekGuamanian/ChamorroGuatemalanGuyaneseHaitianHmongHonduranHopiHoumaHungarianIcelanderIndian (Asian)IndonesianInupiatIranianIraqiIrishIroquoisIsraeliItalianJamaicanJapaneseJordanianKenyanKiowaKoreanLaotianLatvianLebaneseLiberianLithuanianLumbeeLuxembourgerMacedonianMalaysianMalteseMarshalleseMenomineeMexicanMexican American IndianMongolianMoroccanNative HawaiianNavajoNepaleseNew ZealanderNicaraguanNigerianNorthern EuropeanNorwegianOkinawanOsageOttawaPaiutePakistaniPalestinianPanamanianParaguayanPennsylvania GermanPeruvianPimaPolishPortuguesePotawatomiPuebloPuerto RicanPuget Sound SalishRomanianRussianSalvadoranSamoanScandinavianScotch-IrishScottishSeminoleSenegaleseSerbianShoshoneSierra LeoneanSiouxSlavicSlovakSloveneSomaliSouth AfricanSouth AmericanSouth American IndianSoviet UnionSpaniardSpanishSpanish AmericanSpanish American IndianSri LankanSubsaharan AfricanSudaneseSwedishSwissSyrianTaiwaneseThaiTlingit-HaidaTohono O'OdhamTonganTrinidadian and TobagonianTsimshianTurkishU.S. Virgin IslanderUgandanUkrainianUruguayanUteVenezuelanVietnameseWelshWest IndianYakamaYaquiYugoslavianYumanYup'ikZimbabwean
Immigration
NonimmigrantsImmigrantsAfghanistanAfricaAlbaniaArgentinaArmeniaAsiaAustraliaAustriaBahamasBangladeshBarbadosBelarusBelgiumBelizeBoliviaBosnia and HerzegovinaBrazilBulgariaBurma/MyanmarCabo VerdeCambodiaCameroonCanadaCaribbeanCentral AmericaChileChinaColombiaCongoCosta RicaCroatiaCubaCzechoslovakiaDenmarkDominicaDominican RepublicEastern AfricaEastern AsiaEastern EuropeEcuadorEgyptEl SalvadorEnglandEritreaEthiopiaEuropeFijiFranceGermanyGhanaGreeceGrenadaGuatemalaGuyanaHaitiHondurasHong KongHungaryIndiaIndonesiaIranIraqIrelandIsraelItalyJamaicaJapanJordanKazakhstanKenyaKoreaKuwaitLaosLatin AmericaLatviaLebanonLiberiaLithuaniaMalaysiaMexicoMicronesiaMiddle AfricaMoldovaMoroccoNepalNetherlandsNicaraguaNigeriaNorth AmericaNorth MacedoniaNorthern AfricaNorthern EuropeNorwayOceaniaPakistanPanamaPeruPhilippinesPolandPortugalRomaniaRussiaSaudi ArabiaScotlandSenegalSerbiaSierra LeoneSingaporeSomaliaSouth AfricaSouth AmericaSouth Central AsiaSouth Eastern AsiaSouthern EuropeSpainSri LankaSt. Vincent and the GrenadinesSudanSwedenSwitzerlandSyriaTaiwanThailandTrinidad and TobagoTurkeyUgandaUkraineUruguayUzbekistanVenezuelaVietnamWest IndiesWestern AsiaWestern EuropeYemenZaireZimbabweAzores
Unemployment Among Ages 65 to 74 years
Income
Poverty
Unemployment
Labor Participation
Family Structure
Vehicle Availability
Education Level
Disability

Unemployment Among Ages 65 to 74 years Comparison

Immigrants from Western Africa

Immigrants from Bulgaria

Tragic
Exceptional
5.6%
UNEMPLOYMENT AMONG AGES 65 TO 74 YEARS
0.3/ 100
METRIC RATING
258th/ 347
METRIC RANK
5.1%
UNEMPLOYMENT AMONG AGES 65 TO 74 YEARS
99.4/ 100
METRIC RATING
59th/ 347
METRIC RANK

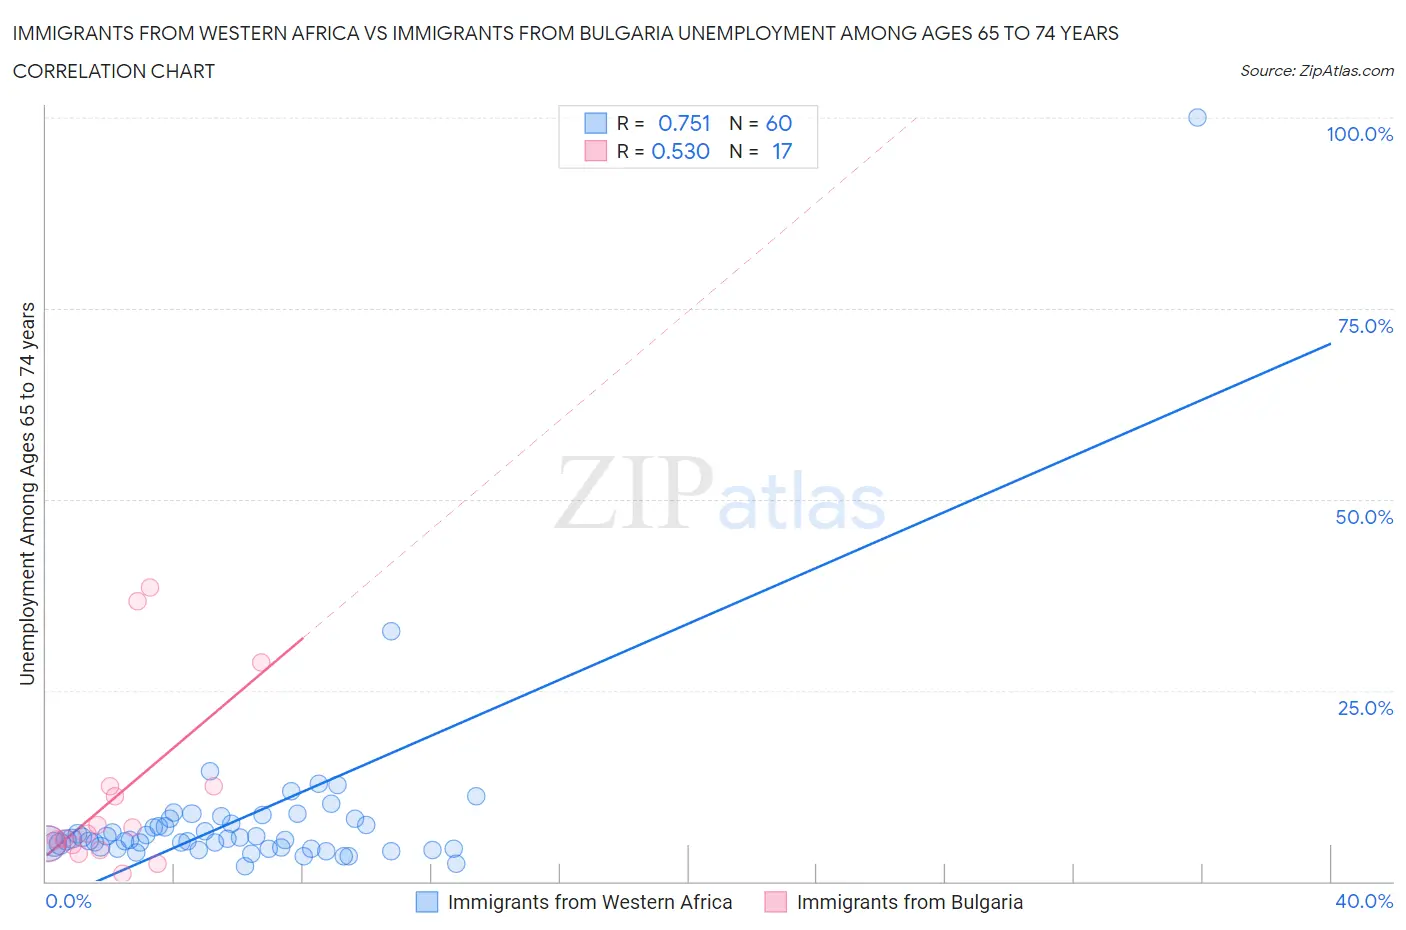
Immigrants from Western Africa vs Immigrants from Bulgaria Unemployment Among Ages 65 to 74 years Correlation Chart

The statistical analysis conducted on geographies consisting of 321,582,029 people shows a strong positive correlation between the proportion of Immigrants from Western Africa and unemployment rate among population between the ages 65 and 74 in the United States with a correlation coefficient (R) of 0.751 and weighted average of 5.6%. Similarly, the statistical analysis conducted on geographies consisting of 163,435,792 people shows a substantial positive correlation between the proportion of Immigrants from Bulgaria and unemployment rate among population between the ages 65 and 74 in the United States with a correlation coefficient (R) of 0.530 and weighted average of 5.1%, a difference of 9.7%.
Immigrants from Western Africa vs Immigrants from Bulgaria Unemployment Among Ages 65 to 74 years

Unemployment Among Ages 65 to 74 years Correlation Summary

MeasurementImmigrants from Western AfricaImmigrants from Bulgaria
Minimum2.0%1.0%
Maximum100.0%38.5%
Range98.0%37.5%
Mean8.2%11.3%
Median5.5%6.2%
Interquartile 25% (IQ1)4.4%4.4%
Interquartile 75% (IQ3)7.9%12.5%
Interquartile Range (IQR)3.5%8.1%
Standard Deviation (Sample)12.8%11.7%
Standard Deviation (Population)12.7%11.4%

Similar Demographics by Unemployment Among Ages 65 to 74 years

Demographics Similar to Immigrants from Western Africa by Unemployment Among Ages 65 to 74 years

In terms of unemployment among ages 65 to 74 years, the demographic groups most similar to Immigrants from Western Africa are Sierra Leonean (5.6%, a difference of 0.070%), Immigrants from Barbados (5.6%, a difference of 0.10%), South American (5.6%, a difference of 0.14%), Immigrants from Southern Europe (5.6%, a difference of 0.16%), and Immigrants from St. Vincent and the Grenadines (5.6%, a difference of 0.19%).
DemographicsRating | RankUnemployment Among Ages 65 to 74 years
Brazilians
0.5
/100
|
#251
Tragic
5.6%
Colombians
0.5
/100
|
#252
Tragic
5.6%
Immigrants | Brazil
0.5
/100
|
#253
Tragic
5.6%
Immigrants | Costa Rica
0.5
/100
|
#254
Tragic
5.6%
Immigrants | Haiti
0.4
/100
|
#255
Tragic
5.6%
Native Hawaiians
0.4
/100
|
#256
Tragic
5.6%
Immigrants | Southern Europe
0.3
/100
|
#257
Tragic
5.6%
Immigrants | Western Africa
0.3
/100
|
#258
Tragic
5.6%
Sierra Leoneans
0.2
/100
|
#259
Tragic
5.6%
Immigrants | Barbados
0.2
/100
|
#260
Tragic
5.6%
South Americans
0.2
/100
|
#261
Tragic
5.6%
Immigrants | St. Vincent and the Grenadines
0.2
/100
|
#262
Tragic
5.6%
Immigrants | Jamaica
0.2
/100
|
#263
Tragic
5.6%
Pueblo
0.2
/100
|
#264
Tragic
5.6%
Jamaicans
0.2
/100
|
#265
Tragic
5.6%

Demographics Similar to Immigrants from Bulgaria by Unemployment Among Ages 65 to 74 years

In terms of unemployment among ages 65 to 74 years, the demographic groups most similar to Immigrants from Bulgaria are German (5.1%, a difference of 0.050%), Immigrants from Jordan (5.1%, a difference of 0.050%), Swedish (5.1%, a difference of 0.10%), Croatian (5.1%, a difference of 0.10%), and Immigrants from Taiwan (5.1%, a difference of 0.12%).
DemographicsRating | RankUnemployment Among Ages 65 to 74 years
Europeans
99.6
/100
|
#52
Exceptional
5.1%
Immigrants | Ethiopia
99.6
/100
|
#53
Exceptional
5.1%
Immigrants | Nicaragua
99.6
/100
|
#54
Exceptional
5.1%
Carpatho Rusyns
99.6
/100
|
#55
Exceptional
5.1%
Swedes
99.5
/100
|
#56
Exceptional
5.1%
Croatians
99.5
/100
|
#57
Exceptional
5.1%
Germans
99.5
/100
|
#58
Exceptional
5.1%
Immigrants | Bulgaria
99.4
/100
|
#59
Exceptional
5.1%
Immigrants | Jordan
99.4
/100
|
#60
Exceptional
5.1%
Immigrants | Taiwan
99.4
/100
|
#61
Exceptional
5.1%
Nicaraguans
99.4
/100
|
#62
Exceptional
5.1%
Kiowa
99.3
/100
|
#63
Exceptional
5.1%
Immigrants | Moldova
99.3
/100
|
#64
Exceptional
5.1%
Bolivians
99.3
/100
|
#65
Exceptional
5.1%
Iroquois
99.3
/100
|
#66
Exceptional
5.1%