Immigrants from West Indies vs Yuman Unemployment Among Ages 35 to 44 years
COMPARE
Immigrants from West Indies
Yuman
Unemployment Among Ages 35 to 44 years
Unemployment Among Ages 35 to 44 years Comparison
Immigrants from West Indies
Yuman
5.6%
UNEMPLOYMENT AMONG AGES 35 TO 44 YEARS
0.0/ 100
METRIC RATING
300th/ 347
METRIC RANK
16.9%
UNEMPLOYMENT AMONG AGES 35 TO 44 YEARS
0.0/ 100
METRIC RATING
347th/ 347
METRIC RANK
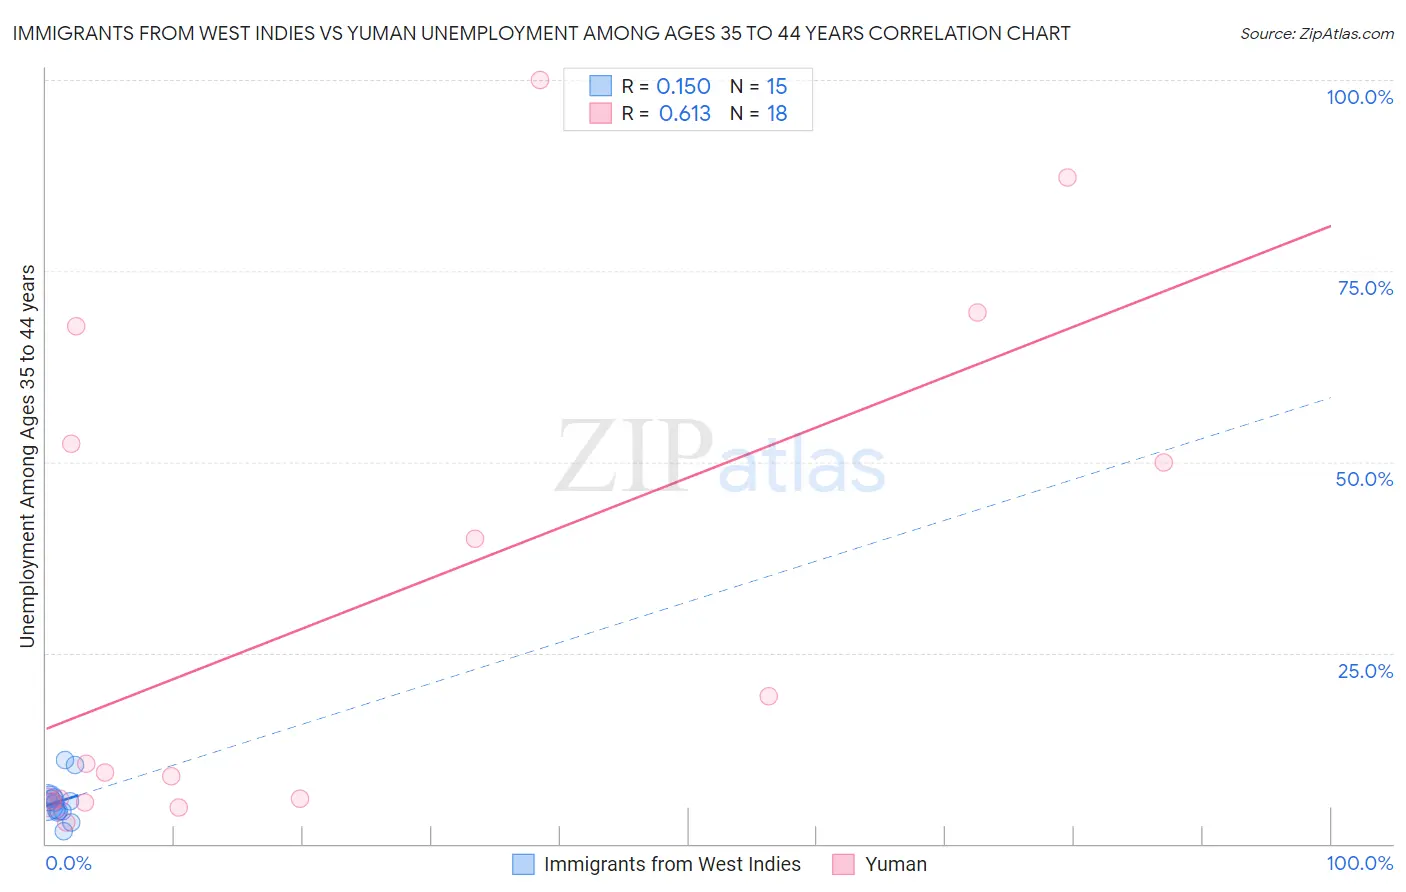
Immigrants from West Indies vs Yuman Unemployment Among Ages 35 to 44 years Correlation Chart
The statistical analysis conducted on geographies consisting of 72,221,527 people shows a poor positive correlation between the proportion of Immigrants from West Indies and unemployment rate among population between the ages 35 and 44 in the United States with a correlation coefficient (R) of 0.150 and weighted average of 5.6%. Similarly, the statistical analysis conducted on geographies consisting of 40,559,593 people shows a significant positive correlation between the proportion of Yuman and unemployment rate among population between the ages 35 and 44 in the United States with a correlation coefficient (R) of 0.613 and weighted average of 16.9%, a difference of 202.8%.
Unemployment Among Ages 35 to 44 years Correlation Summary
| Measurement | Immigrants from West Indies | Yuman |
| Minimum | 1.7% | 2.8% |
| Maximum | 10.9% | 100.0% |
| Range | 9.2% | 97.2% |
| Mean | 5.5% | 30.6% |
| Median | 5.5% | 9.9% |
| Interquartile 25% (IQ1) | 4.2% | 5.6% |
| Interquartile 75% (IQ3) | 6.1% | 52.4% |
| Interquartile Range (IQR) | 1.9% | 46.8% |
| Standard Deviation (Sample) | 2.4% | 32.4% |
| Standard Deviation (Population) | 2.3% | 31.5% |
Similar Demographics by Unemployment Among Ages 35 to 44 years
Demographics Similar to Immigrants from West Indies by Unemployment Among Ages 35 to 44 years
In terms of unemployment among ages 35 to 44 years, the demographic groups most similar to Immigrants from West Indies are African (5.6%, a difference of 0.040%), Immigrants from Jamaica (5.6%, a difference of 0.050%), Aleut (5.6%, a difference of 0.15%), U.S. Virgin Islander (5.6%, a difference of 0.16%), and Nepalese (5.6%, a difference of 0.17%).
| Demographics | Rating | Rank | Unemployment Among Ages 35 to 44 years |
| Central American Indians | 0.0 /100 | #293 | Tragic 5.6% |
| Trinidadians and Tobagonians | 0.0 /100 | #294 | Tragic 5.6% |
| Ottawa | 0.0 /100 | #295 | Tragic 5.6% |
| Immigrants | Trinidad and Tobago | 0.0 /100 | #296 | Tragic 5.6% |
| U.S. Virgin Islanders | 0.0 /100 | #297 | Tragic 5.6% |
| Aleuts | 0.0 /100 | #298 | Tragic 5.6% |
| Immigrants | Jamaica | 0.0 /100 | #299 | Tragic 5.6% |
| Immigrants | West Indies | 0.0 /100 | #300 | Tragic 5.6% |
| Africans | 0.0 /100 | #301 | Tragic 5.6% |
| Nepalese | 0.0 /100 | #302 | Tragic 5.6% |
| Yakama | 0.0 /100 | #303 | Tragic 5.6% |
| West Indians | 0.0 /100 | #304 | Tragic 5.7% |
| Belizeans | 0.0 /100 | #305 | Tragic 5.7% |
| Barbadians | 0.0 /100 | #306 | Tragic 5.7% |
| Immigrants | Belize | 0.0 /100 | #307 | Tragic 5.8% |
Demographics Similar to Yuman by Unemployment Among Ages 35 to 44 years
In terms of unemployment among ages 35 to 44 years, the demographic groups most similar to Yuman are Crow (15.7%, a difference of 7.7%), Yup'ik (14.4%, a difference of 17.2%), Pima (11.8%, a difference of 43.8%), Arapaho (10.3%, a difference of 64.4%), and Navajo (9.3%, a difference of 81.1%).
| Demographics | Rating | Rank | Unemployment Among Ages 35 to 44 years |
| Puerto Ricans | 0.0 /100 | #333 | Tragic 7.6% |
| Houma | 0.0 /100 | #334 | Tragic 7.8% |
| Sioux | 0.0 /100 | #335 | Tragic 8.4% |
| Apache | 0.0 /100 | #336 | Tragic 8.4% |
| Tohono O'odham | 0.0 /100 | #337 | Tragic 8.4% |
| Cheyenne | 0.0 /100 | #338 | Tragic 8.5% |
| Inupiat | 0.0 /100 | #339 | Tragic 8.6% |
| Alaskan Athabascans | 0.0 /100 | #340 | Tragic 8.6% |
| Hopi | 0.0 /100 | #341 | Tragic 8.9% |
| Navajo | 0.0 /100 | #342 | Tragic 9.3% |
| Arapaho | 0.0 /100 | #343 | Tragic 10.3% |
| Pima | 0.0 /100 | #344 | Tragic 11.8% |
| Yup'ik | 0.0 /100 | #345 | Tragic 14.4% |
| Crow | 0.0 /100 | #346 | Tragic 15.7% |
| Yuman | 0.0 /100 | #347 | Tragic 16.9% |