Immigrants from Uzbekistan vs Immigrants from Honduras Unemployment Among Women with Children Ages 6 to 17 years
COMPARE
Immigrants from Uzbekistan
Immigrants from Honduras
Unemployment Among Women with Children Ages 6 to 17 years
Unemployment Among Women with Children Ages 6 to 17 years Comparison
Immigrants from Uzbekistan
Immigrants from Honduras
7.8%
UNEMPLOYMENT AMONG WOMEN WITH CHILDREN AGES 6 TO 17 YEARS
100.0/ 100
METRIC RATING
28th/ 347
METRIC RANK
10.1%
UNEMPLOYMENT AMONG WOMEN WITH CHILDREN AGES 6 TO 17 YEARS
0.0/ 100
METRIC RATING
299th/ 347
METRIC RANK
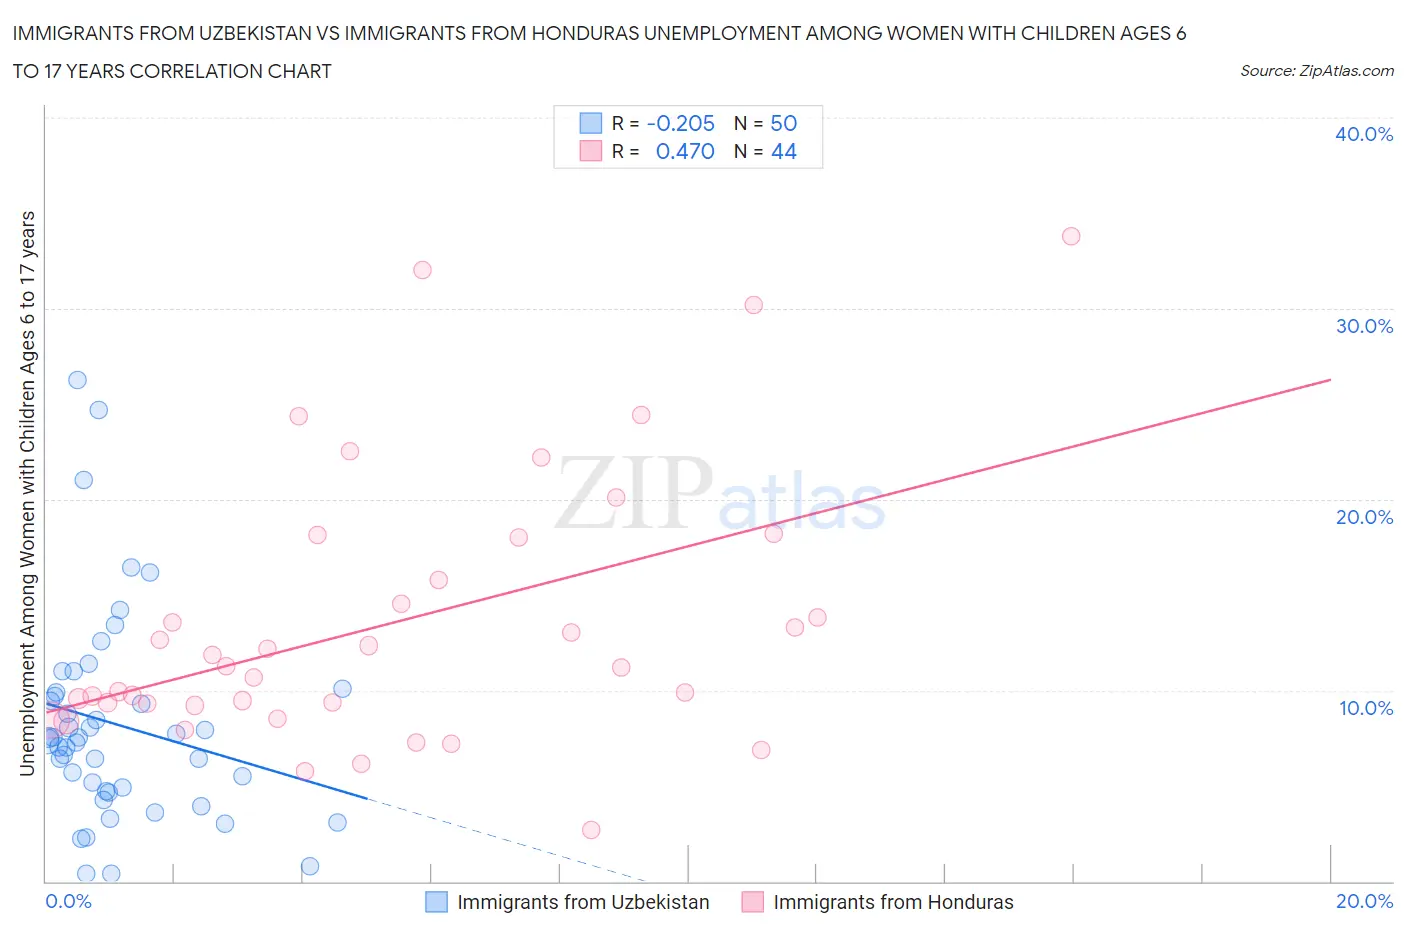
Immigrants from Uzbekistan vs Immigrants from Honduras Unemployment Among Women with Children Ages 6 to 17 years Correlation Chart
The statistical analysis conducted on geographies consisting of 101,911,425 people shows a weak negative correlation between the proportion of Immigrants from Uzbekistan and unemployment rate among women with children between the ages 6 and 17 in the United States with a correlation coefficient (R) of -0.205 and weighted average of 7.8%. Similarly, the statistical analysis conducted on geographies consisting of 250,516,904 people shows a moderate positive correlation between the proportion of Immigrants from Honduras and unemployment rate among women with children between the ages 6 and 17 in the United States with a correlation coefficient (R) of 0.470 and weighted average of 10.1%, a difference of 29.4%.
Unemployment Among Women with Children Ages 6 to 17 years Correlation Summary
| Measurement | Immigrants from Uzbekistan | Immigrants from Honduras |
| Minimum | 0.40% | 2.7% |
| Maximum | 26.3% | 33.8% |
| Range | 25.9% | 31.1% |
| Mean | 8.2% | 13.5% |
| Median | 7.4% | 11.2% |
| Interquartile 25% (IQ1) | 4.7% | 9.3% |
| Interquartile 75% (IQ3) | 9.9% | 16.9% |
| Interquartile Range (IQR) | 5.2% | 7.6% |
| Standard Deviation (Sample) | 5.5% | 7.1% |
| Standard Deviation (Population) | 5.4% | 7.0% |
Similar Demographics by Unemployment Among Women with Children Ages 6 to 17 years
Demographics Similar to Immigrants from Uzbekistan by Unemployment Among Women with Children Ages 6 to 17 years
In terms of unemployment among women with children ages 6 to 17 years, the demographic groups most similar to Immigrants from Uzbekistan are Immigrants from Afghanistan (7.8%, a difference of 0.33%), Thai (7.8%, a difference of 0.34%), Immigrants from Eastern Asia (7.7%, a difference of 0.96%), Indian (Asian) (7.7%, a difference of 0.96%), and Nepalese (7.7%, a difference of 1.1%).
| Demographics | Rating | Rank | Unemployment Among Women with Children Ages 6 to 17 years |
| Immigrants | India | 100.0 /100 | #21 | Exceptional 7.7% |
| Immigrants | China | 100.0 /100 | #22 | Exceptional 7.7% |
| Immigrants | Indonesia | 100.0 /100 | #23 | Exceptional 7.7% |
| Nepalese | 100.0 /100 | #24 | Exceptional 7.7% |
| Immigrants | Eastern Asia | 100.0 /100 | #25 | Exceptional 7.7% |
| Indians (Asian) | 100.0 /100 | #26 | Exceptional 7.7% |
| Immigrants | Afghanistan | 100.0 /100 | #27 | Exceptional 7.8% |
| Immigrants | Uzbekistan | 100.0 /100 | #28 | Exceptional 7.8% |
| Thais | 100.0 /100 | #29 | Exceptional 7.8% |
| Immigrants | Iran | 100.0 /100 | #30 | Exceptional 7.9% |
| Laotians | 100.0 /100 | #31 | Exceptional 7.9% |
| Immigrants | Cambodia | 100.0 /100 | #32 | Exceptional 7.9% |
| Immigrants | Korea | 100.0 /100 | #33 | Exceptional 7.9% |
| Native Hawaiians | 100.0 /100 | #34 | Exceptional 7.9% |
| Immigrants | South Central Asia | 100.0 /100 | #35 | Exceptional 7.9% |
Demographics Similar to Immigrants from Honduras by Unemployment Among Women with Children Ages 6 to 17 years
In terms of unemployment among women with children ages 6 to 17 years, the demographic groups most similar to Immigrants from Honduras are Immigrants from Haiti (10.1%, a difference of 0.020%), Nigerian (10.1%, a difference of 0.020%), Immigrants from Bahamas (10.1%, a difference of 0.18%), Immigrants from Caribbean (10.1%, a difference of 0.32%), and Immigrants from Western Africa (10.1%, a difference of 0.34%).
| Demographics | Rating | Rank | Unemployment Among Women with Children Ages 6 to 17 years |
| Carpatho Rusyns | 0.0 /100 | #292 | Tragic 10.0% |
| Haitians | 0.0 /100 | #293 | Tragic 10.0% |
| Ecuadorians | 0.0 /100 | #294 | Tragic 10.0% |
| Cherokee | 0.0 /100 | #295 | Tragic 10.0% |
| Immigrants | Western Africa | 0.0 /100 | #296 | Tragic 10.1% |
| Immigrants | Caribbean | 0.0 /100 | #297 | Tragic 10.1% |
| Immigrants | Haiti | 0.0 /100 | #298 | Tragic 10.1% |
| Immigrants | Honduras | 0.0 /100 | #299 | Tragic 10.1% |
| Nigerians | 0.0 /100 | #300 | Tragic 10.1% |
| Immigrants | Bahamas | 0.0 /100 | #301 | Tragic 10.1% |
| Venezuelans | 0.0 /100 | #302 | Tragic 10.2% |
| Immigrants | Ecuador | 0.0 /100 | #303 | Tragic 10.2% |
| Immigrants | Venezuela | 0.0 /100 | #304 | Tragic 10.2% |
| Immigrants | Nigeria | 0.0 /100 | #305 | Tragic 10.2% |
| Paraguayans | 0.0 /100 | #306 | Tragic 10.2% |