Immigrants from Uruguay vs Taiwanese Unemployment Among Seniors over 75 years
COMPARE
Immigrants from Uruguay
Taiwanese
Unemployment Among Seniors over 75 years
Unemployment Among Seniors over 75 years Comparison
Immigrants from Uruguay
Taiwanese
7.5%
UNEMPLOYMENT AMONG SENIORS OVER 75 YEARS
100.0/ 100
METRIC RATING
25th/ 347
METRIC RANK
6.6%
UNEMPLOYMENT AMONG SENIORS OVER 75 YEARS
100.0/ 100
METRIC RATING
8th/ 347
METRIC RANK
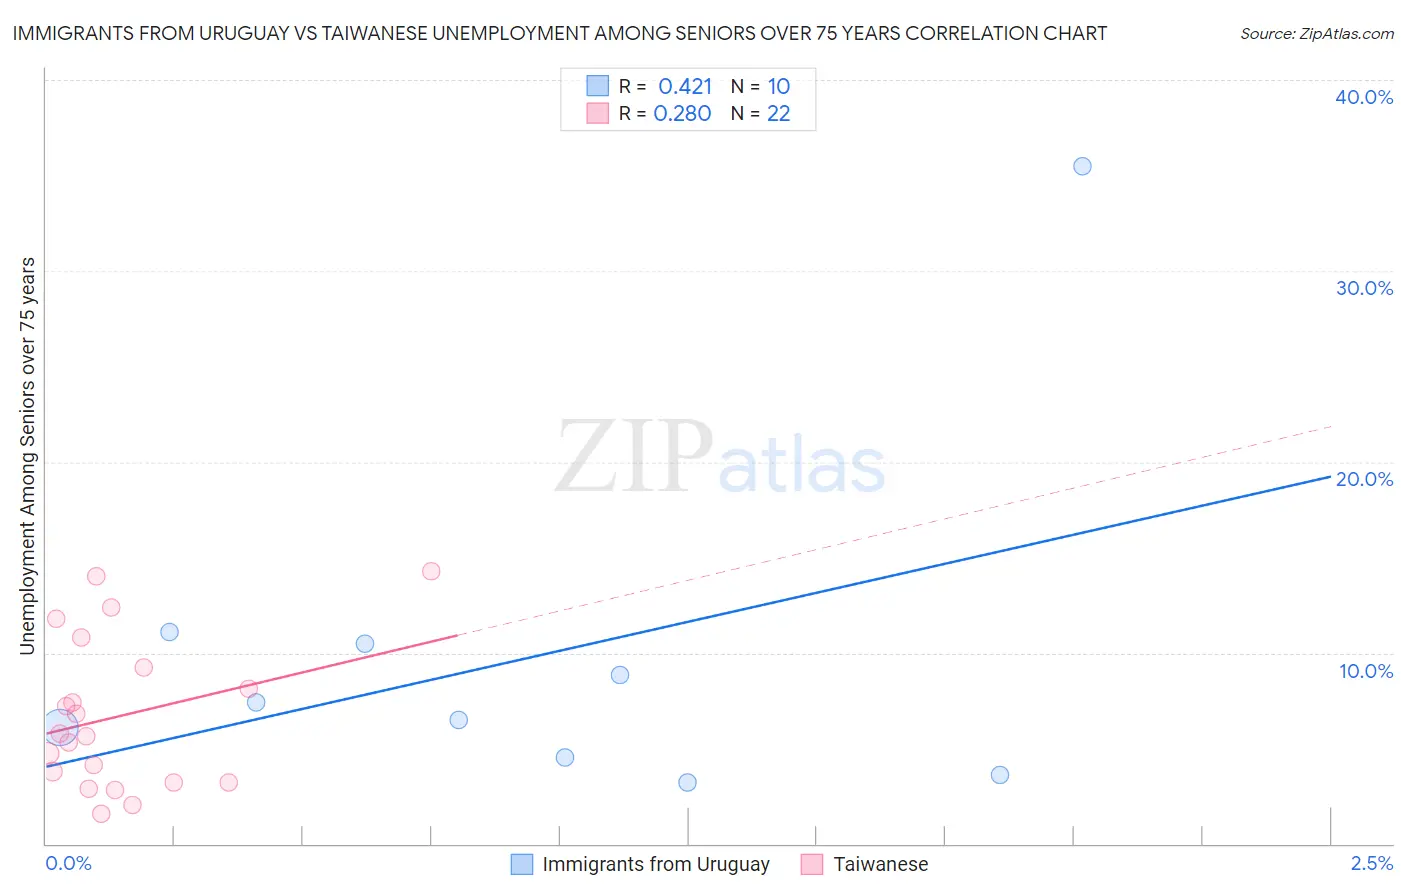
Immigrants from Uruguay vs Taiwanese Unemployment Among Seniors over 75 years Correlation Chart
The statistical analysis conducted on geographies consisting of 96,799,113 people shows a moderate positive correlation between the proportion of Immigrants from Uruguay and unemployment rate among seniors over the age of 75 in the United States with a correlation coefficient (R) of 0.421 and weighted average of 7.5%. Similarly, the statistical analysis conducted on geographies consisting of 28,875,241 people shows a weak positive correlation between the proportion of Taiwanese and unemployment rate among seniors over the age of 75 in the United States with a correlation coefficient (R) of 0.280 and weighted average of 6.6%, a difference of 14.5%.
Unemployment Among Seniors over 75 years Correlation Summary
| Measurement | Immigrants from Uruguay | Taiwanese |
| Minimum | 3.2% | 1.6% |
| Maximum | 35.5% | 14.3% |
| Range | 32.3% | 12.7% |
| Mean | 9.7% | 6.7% |
| Median | 6.9% | 5.7% |
| Interquartile 25% (IQ1) | 4.5% | 3.2% |
| Interquartile 75% (IQ3) | 10.5% | 9.2% |
| Interquartile Range (IQR) | 5.9% | 6.0% |
| Standard Deviation (Sample) | 9.5% | 3.9% |
| Standard Deviation (Population) | 9.0% | 3.8% |
Demographics Similar to Immigrants from Uruguay and Taiwanese by Unemployment Among Seniors over 75 years
In terms of unemployment among seniors over 75 years, the demographic groups most similar to Immigrants from Uruguay are South African (7.5%, a difference of 0.18%), Immigrants from Cuba (7.4%, a difference of 1.1%), Israeli (7.4%, a difference of 1.2%), Cypriot (7.4%, a difference of 1.5%), and Chickasaw (7.3%, a difference of 2.3%). Similarly, the demographic groups most similar to Taiwanese are Spanish American Indian (6.5%, a difference of 0.41%), Immigrants from Armenia (6.5%, a difference of 0.79%), Soviet Union (6.6%, a difference of 1.3%), Yuman (6.7%, a difference of 1.5%), and Immigrants from Grenada (6.7%, a difference of 1.6%).
| Demographics | Rating | Rank | Unemployment Among Seniors over 75 years |
| Immigrants | Armenia | 100.0 /100 | #6 | Exceptional 6.5% |
| Spanish American Indians | 100.0 /100 | #7 | Exceptional 6.5% |
| Taiwanese | 100.0 /100 | #8 | Exceptional 6.6% |
| Soviet Union | 100.0 /100 | #9 | Exceptional 6.6% |
| Yuman | 100.0 /100 | #10 | Exceptional 6.7% |
| Immigrants | Grenada | 100.0 /100 | #11 | Exceptional 6.7% |
| Comanche | 100.0 /100 | #12 | Exceptional 6.7% |
| Immigrants | Congo | 100.0 /100 | #13 | Exceptional 6.7% |
| Ute | 100.0 /100 | #14 | Exceptional 6.8% |
| Icelanders | 100.0 /100 | #15 | Exceptional 7.0% |
| Seminole | 100.0 /100 | #16 | Exceptional 7.1% |
| Immigrants | Switzerland | 100.0 /100 | #17 | Exceptional 7.2% |
| Immigrants | Uzbekistan | 100.0 /100 | #18 | Exceptional 7.2% |
| Immigrants | Zaire | 100.0 /100 | #19 | Exceptional 7.2% |
| Armenians | 100.0 /100 | #20 | Exceptional 7.2% |
| Chickasaw | 100.0 /100 | #21 | Exceptional 7.3% |
| Cypriots | 100.0 /100 | #22 | Exceptional 7.4% |
| Israelis | 100.0 /100 | #23 | Exceptional 7.4% |
| Immigrants | Cuba | 100.0 /100 | #24 | Exceptional 7.4% |
| Immigrants | Uruguay | 100.0 /100 | #25 | Exceptional 7.5% |
| South Africans | 100.0 /100 | #26 | Exceptional 7.5% |