Immigrants from Uruguay vs Choctaw Unemployment Among Seniors over 75 years
COMPARE
Immigrants from Uruguay
Choctaw
Unemployment Among Seniors over 75 years
Unemployment Among Seniors over 75 years Comparison
Immigrants from Uruguay
Choctaw
7.5%
UNEMPLOYMENT AMONG SENIORS OVER 75 YEARS
100.0/ 100
METRIC RATING
25th/ 347
METRIC RANK
8.8%
UNEMPLOYMENT AMONG SENIORS OVER 75 YEARS
37.1/ 100
METRIC RATING
185th/ 347
METRIC RANK
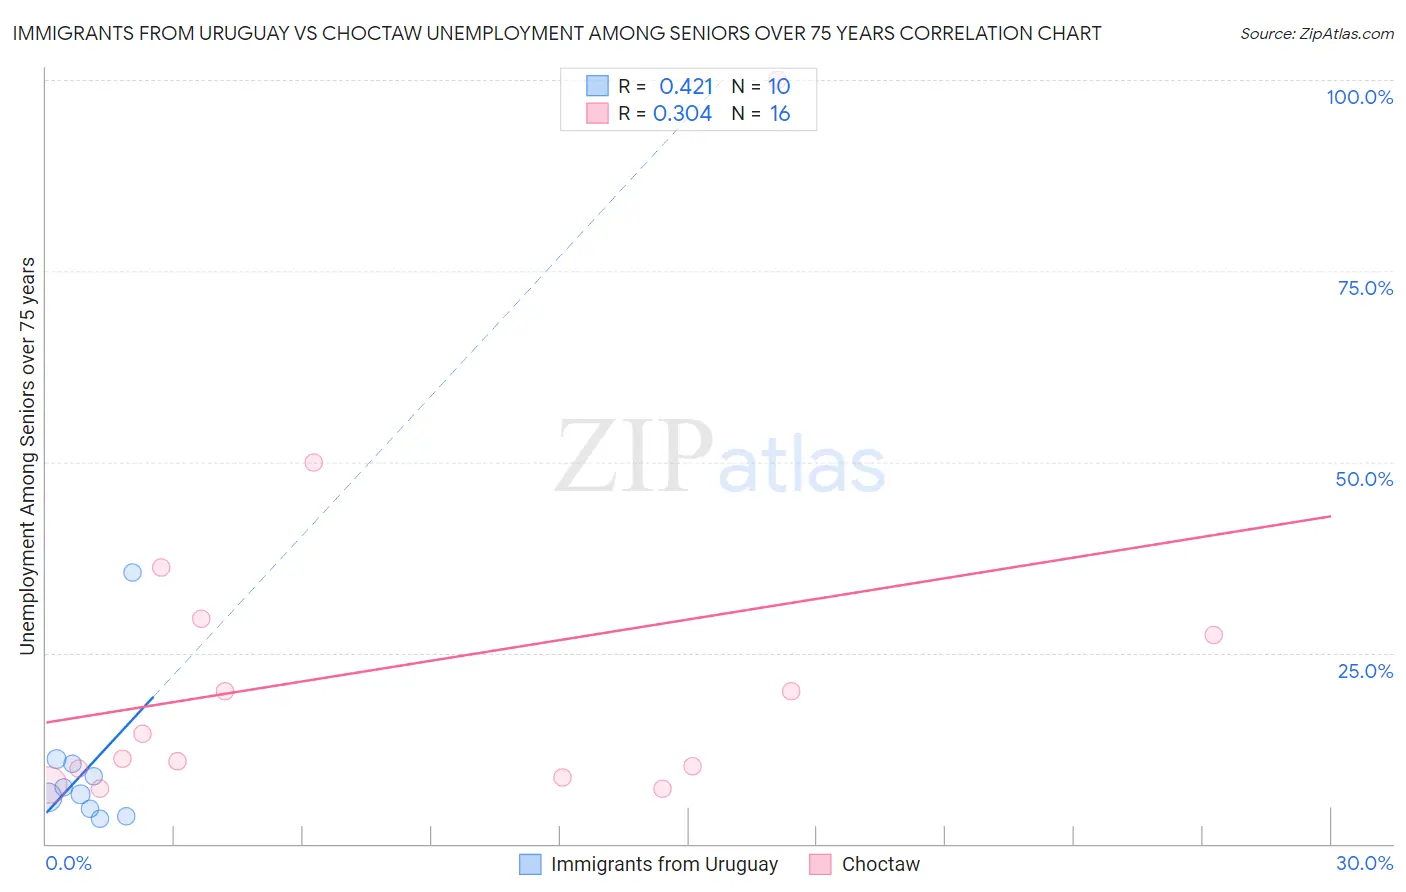
Immigrants from Uruguay vs Choctaw Unemployment Among Seniors over 75 years Correlation Chart
The statistical analysis conducted on geographies consisting of 96,799,113 people shows a moderate positive correlation between the proportion of Immigrants from Uruguay and unemployment rate among seniors over the age of 75 in the United States with a correlation coefficient (R) of 0.421 and weighted average of 7.5%. Similarly, the statistical analysis conducted on geographies consisting of 150,936,994 people shows a mild positive correlation between the proportion of Choctaw and unemployment rate among seniors over the age of 75 in the United States with a correlation coefficient (R) of 0.304 and weighted average of 8.8%, a difference of 17.2%.
Unemployment Among Seniors over 75 years Correlation Summary
| Measurement | Immigrants from Uruguay | Choctaw |
| Minimum | 3.2% | 7.2% |
| Maximum | 35.5% | 100.0% |
| Range | 32.3% | 92.8% |
| Mean | 9.7% | 23.1% |
| Median | 6.9% | 12.8% |
| Interquartile 25% (IQ1) | 4.5% | 9.2% |
| Interquartile 75% (IQ3) | 10.5% | 28.4% |
| Interquartile Range (IQR) | 5.9% | 19.1% |
| Standard Deviation (Sample) | 9.5% | 23.9% |
| Standard Deviation (Population) | 9.0% | 23.1% |
Similar Demographics by Unemployment Among Seniors over 75 years
Demographics Similar to Immigrants from Uruguay by Unemployment Among Seniors over 75 years
In terms of unemployment among seniors over 75 years, the demographic groups most similar to Immigrants from Uruguay are South African (7.5%, a difference of 0.18%), Immigrants from Barbados (7.6%, a difference of 0.62%), Immigrants from Israel (7.6%, a difference of 0.73%), Immigrants from Iran (7.6%, a difference of 0.78%), and Immigrants from Sweden (7.6%, a difference of 0.89%).
| Demographics | Rating | Rank | Unemployment Among Seniors over 75 years |
| Immigrants | Uzbekistan | 100.0 /100 | #18 | Exceptional 7.2% |
| Immigrants | Zaire | 100.0 /100 | #19 | Exceptional 7.2% |
| Armenians | 100.0 /100 | #20 | Exceptional 7.2% |
| Chickasaw | 100.0 /100 | #21 | Exceptional 7.3% |
| Cypriots | 100.0 /100 | #22 | Exceptional 7.4% |
| Israelis | 100.0 /100 | #23 | Exceptional 7.4% |
| Immigrants | Cuba | 100.0 /100 | #24 | Exceptional 7.4% |
| Immigrants | Uruguay | 100.0 /100 | #25 | Exceptional 7.5% |
| South Africans | 100.0 /100 | #26 | Exceptional 7.5% |
| Immigrants | Barbados | 100.0 /100 | #27 | Exceptional 7.6% |
| Immigrants | Israel | 100.0 /100 | #28 | Exceptional 7.6% |
| Immigrants | Iran | 100.0 /100 | #29 | Exceptional 7.6% |
| Immigrants | Sweden | 100.0 /100 | #30 | Exceptional 7.6% |
| Guyanese | 100.0 /100 | #31 | Exceptional 7.6% |
| Immigrants | Hong Kong | 100.0 /100 | #32 | Exceptional 7.6% |
Demographics Similar to Choctaw by Unemployment Among Seniors over 75 years
In terms of unemployment among seniors over 75 years, the demographic groups most similar to Choctaw are Immigrants from Micronesia (8.8%, a difference of 0.0%), Immigrants from Ethiopia (8.8%, a difference of 0.050%), Immigrants from Afghanistan (8.8%, a difference of 0.060%), Immigrants from Europe (8.8%, a difference of 0.11%), and Guatemalan (8.8%, a difference of 0.13%).
| Demographics | Rating | Rank | Unemployment Among Seniors over 75 years |
| West Indians | 41.9 /100 | #178 | Average 8.8% |
| Immigrants | Italy | 41.7 /100 | #179 | Average 8.8% |
| Immigrants | Somalia | 41.7 /100 | #180 | Average 8.8% |
| Immigrants | Thailand | 40.2 /100 | #181 | Average 8.8% |
| Guatemalans | 39.5 /100 | #182 | Fair 8.8% |
| Immigrants | Afghanistan | 38.2 /100 | #183 | Fair 8.8% |
| Immigrants | Micronesia | 37.2 /100 | #184 | Fair 8.8% |
| Choctaw | 37.1 /100 | #185 | Fair 8.8% |
| Immigrants | Ethiopia | 36.2 /100 | #186 | Fair 8.8% |
| Immigrants | Europe | 35.2 /100 | #187 | Fair 8.8% |
| Immigrants | Eastern Europe | 34.7 /100 | #188 | Fair 8.8% |
| Immigrants | Haiti | 34.7 /100 | #189 | Fair 8.8% |
| Mexican American Indians | 34.7 /100 | #190 | Fair 8.8% |
| Estonians | 33.3 /100 | #191 | Fair 8.8% |
| Immigrants | Kenya | 31.8 /100 | #192 | Fair 8.8% |