Immigrants from Uruguay vs Sudanese Unemployment Among Women with Children Under 18 years
COMPARE
Immigrants from Uruguay
Sudanese
Unemployment Among Women with Children Under 18 years
Unemployment Among Women with Children Under 18 years Comparison
Immigrants from Uruguay
Sudanese
5.9%
UNEMPLOYMENT AMONG WOMEN WITH CHILDREN UNDER 18 YEARS
1.1/ 100
METRIC RATING
243rd/ 347
METRIC RANK
5.3%
UNEMPLOYMENT AMONG WOMEN WITH CHILDREN UNDER 18 YEARS
84.3/ 100
METRIC RATING
123rd/ 347
METRIC RANK
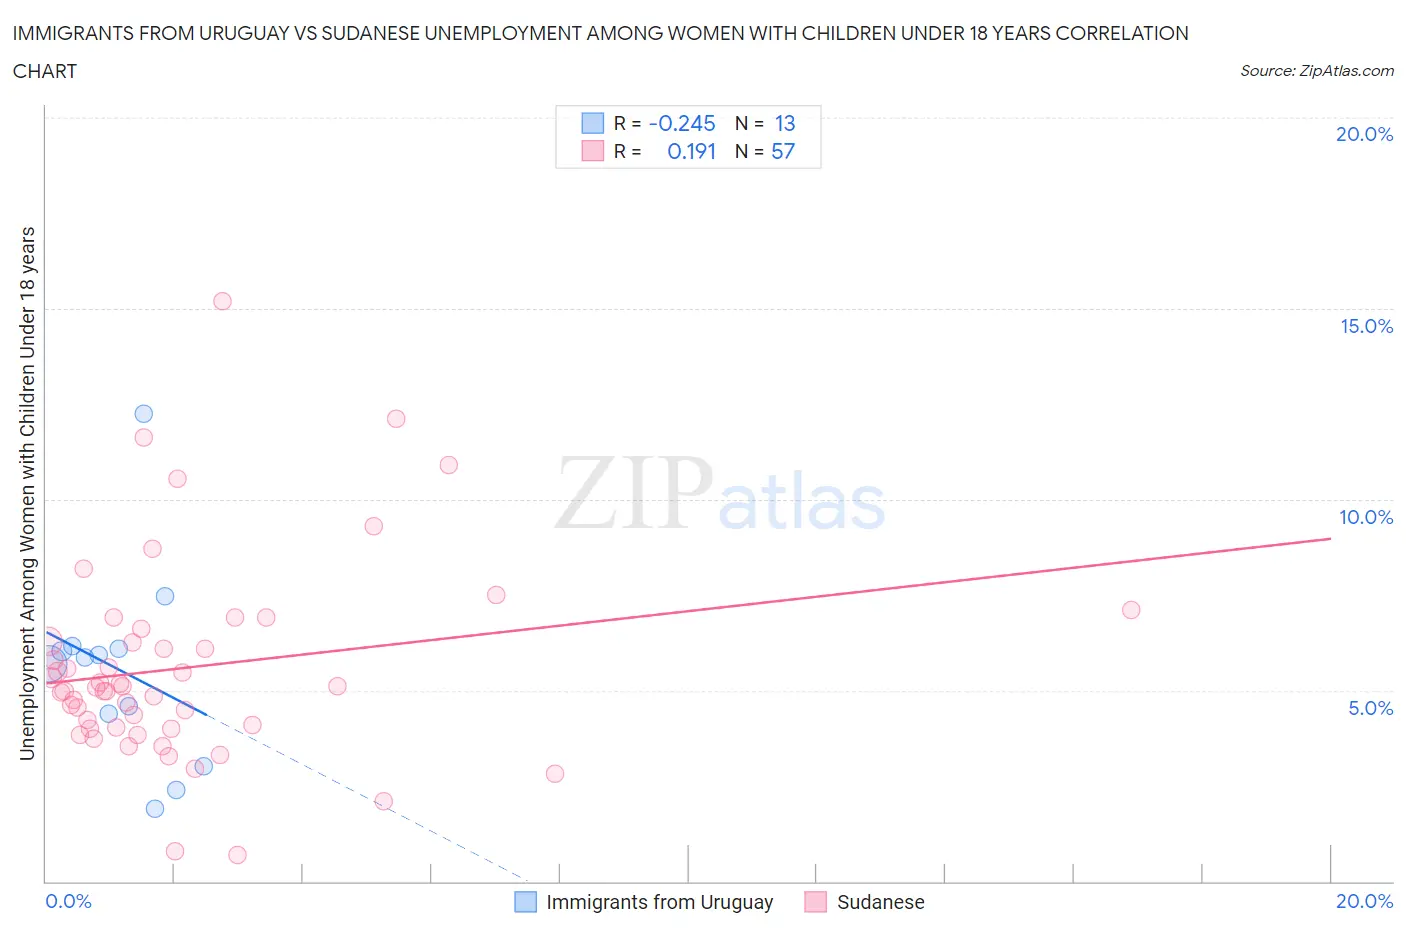
Immigrants from Uruguay vs Sudanese Unemployment Among Women with Children Under 18 years Correlation Chart
The statistical analysis conducted on geographies consisting of 131,973,027 people shows a weak negative correlation between the proportion of Immigrants from Uruguay and unemployment rate among women with children under the age of 18 in the United States with a correlation coefficient (R) of -0.245 and weighted average of 5.9%. Similarly, the statistical analysis conducted on geographies consisting of 109,134,531 people shows a poor positive correlation between the proportion of Sudanese and unemployment rate among women with children under the age of 18 in the United States with a correlation coefficient (R) of 0.191 and weighted average of 5.3%, a difference of 11.2%.
Unemployment Among Women with Children Under 18 years Correlation Summary
| Measurement | Immigrants from Uruguay | Sudanese |
| Minimum | 1.9% | 0.70% |
| Maximum | 12.2% | 15.2% |
| Range | 10.3% | 14.5% |
| Mean | 5.5% | 5.6% |
| Median | 5.9% | 5.1% |
| Interquartile 25% (IQ1) | 3.7% | 4.0% |
| Interquartile 75% (IQ3) | 6.1% | 6.5% |
| Interquartile Range (IQR) | 2.4% | 2.4% |
| Standard Deviation (Sample) | 2.6% | 2.6% |
| Standard Deviation (Population) | 2.5% | 2.6% |
Similar Demographics by Unemployment Among Women with Children Under 18 years
Demographics Similar to Immigrants from Uruguay by Unemployment Among Women with Children Under 18 years
In terms of unemployment among women with children under 18 years, the demographic groups most similar to Immigrants from Uruguay are Choctaw (5.9%, a difference of 0.050%), Ugandan (5.9%, a difference of 0.090%), Uruguayan (5.9%, a difference of 0.22%), Moroccan (5.9%, a difference of 0.29%), and Cape Verdean (5.9%, a difference of 0.29%).
| Demographics | Rating | Rank | Unemployment Among Women with Children Under 18 years |
| Alsatians | 2.5 /100 | #236 | Tragic 5.8% |
| Immigrants | Lebanon | 2.4 /100 | #237 | Tragic 5.8% |
| Immigrants | Somalia | 2.2 /100 | #238 | Tragic 5.8% |
| Immigrants | Sierra Leone | 2.0 /100 | #239 | Tragic 5.8% |
| Immigrants | Immigrants | 2.0 /100 | #240 | Tragic 5.8% |
| Brazilians | 1.6 /100 | #241 | Tragic 5.8% |
| Moroccans | 1.4 /100 | #242 | Tragic 5.9% |
| Immigrants | Uruguay | 1.1 /100 | #243 | Tragic 5.9% |
| Choctaw | 1.1 /100 | #244 | Tragic 5.9% |
| Ugandans | 1.1 /100 | #245 | Tragic 5.9% |
| Uruguayans | 1.0 /100 | #246 | Tragic 5.9% |
| Cape Verdeans | 1.0 /100 | #247 | Tragic 5.9% |
| Delaware | 0.8 /100 | #248 | Tragic 5.9% |
| Immigrants | Cameroon | 0.8 /100 | #249 | Tragic 5.9% |
| Immigrants | Cabo Verde | 0.7 /100 | #250 | Tragic 5.9% |
Demographics Similar to Sudanese by Unemployment Among Women with Children Under 18 years
In terms of unemployment among women with children under 18 years, the demographic groups most similar to Sudanese are Native Hawaiian (5.3%, a difference of 0.050%), Immigrants from North Macedonia (5.3%, a difference of 0.16%), Immigrants from Oceania (5.3%, a difference of 0.17%), Scotch-Irish (5.3%, a difference of 0.20%), and White/Caucasian (5.3%, a difference of 0.20%).
| Demographics | Rating | Rank | Unemployment Among Women with Children Under 18 years |
| Macedonians | 87.7 /100 | #116 | Excellent 5.3% |
| Canadians | 87.4 /100 | #117 | Excellent 5.3% |
| Immigrants | Europe | 86.7 /100 | #118 | Excellent 5.3% |
| Basques | 86.5 /100 | #119 | Excellent 5.3% |
| Egyptians | 86.4 /100 | #120 | Excellent 5.3% |
| Immigrants | Romania | 85.8 /100 | #121 | Excellent 5.3% |
| Scotch-Irish | 85.7 /100 | #122 | Excellent 5.3% |
| Sudanese | 84.3 /100 | #123 | Excellent 5.3% |
| Native Hawaiians | 84.0 /100 | #124 | Excellent 5.3% |
| Immigrants | North Macedonia | 83.2 /100 | #125 | Excellent 5.3% |
| Immigrants | Oceania | 83.1 /100 | #126 | Excellent 5.3% |
| Whites/Caucasians | 82.9 /100 | #127 | Excellent 5.3% |
| Immigrants | South Africa | 82.8 /100 | #128 | Excellent 5.3% |
| Immigrants | Italy | 82.3 /100 | #129 | Excellent 5.3% |
| Immigrants | Austria | 82.1 /100 | #130 | Excellent 5.3% |