Immigrants from Uruguay vs Cambodian Unemployment Among Ages 45 to 54 years

COMPARE

Immigrants from Uruguay
Race
Ancestry
AfghanAfricanAlaska NativeAlaskan AthabascanAlbanianAleutAlsatianAmericanApacheArabArapahoArgentineanArmenianAssyrian/Chaldean/SyriacAustralianAustrianBahamianBangladeshiBarbadianBasqueBelgianBelizeanBermudanBhutaneseBlackfeetBolivianBrazilianBritishBritish West IndianBulgarianBurmeseCajunCanadianCape VerdeanCarpatho RusynCelticCentral AmericanCentral American IndianCherokeeCheyenneChickasawChileanChineseChippewaChoctawColombianColvilleComancheCosta RicanCreeCreekCroatianCrowCubanCypriotCzechCzechoslovakianDanishDelawareDominicanDutchDutch West IndianEastern EuropeanEcuadorianEgyptianEnglishEstonianEthiopianEuropeanFijianFilipinoFinnishFrenchFrench American IndianFrench CanadianGermanGerman RussianGhanaianGreekGuamanian/ChamorroGuatemalanGuyaneseHaitianHmongHonduranHopiHoumaHungarianIcelanderIndian (Asian)IndonesianInupiatIranianIraqiIrishIroquoisIsraeliItalianJamaicanJapaneseJordanianKenyanKiowaKoreanLaotianLatvianLebaneseLiberianLithuanianLumbeeLuxembourgerMacedonianMalaysianMalteseMarshalleseMenomineeMexicanMexican American IndianMongolianMoroccanNative HawaiianNavajoNepaleseNew ZealanderNicaraguanNigerianNorthern EuropeanNorwegianOkinawanOsageOttawaPaiutePakistaniPalestinianPanamanianParaguayanPennsylvania GermanPeruvianPimaPolishPortuguesePotawatomiPuebloPuerto RicanPuget Sound SalishRomanianRussianSalvadoranSamoanScandinavianScotch-IrishScottishSeminoleSenegaleseSerbianShoshoneSierra LeoneanSiouxSlavicSlovakSloveneSomaliSouth AfricanSouth AmericanSouth American IndianSoviet UnionSpaniardSpanishSpanish AmericanSpanish American IndianSri LankanSubsaharan AfricanSudaneseSwedishSwissSyrianTaiwaneseThaiTlingit-HaidaTohono O'OdhamTonganTrinidadian and TobagonianTsimshianTurkishU.S. Virgin IslanderUgandanUkrainianUruguayanUteVenezuelanVietnameseWelshWest IndianYakamaYaquiYugoslavianYumanYup'ikZimbabwean
Immigration
NonimmigrantsImmigrantsAfghanistanAfricaAlbaniaArgentinaArmeniaAsiaAustraliaAustriaBahamasBangladeshBarbadosBelarusBelgiumBelizeBoliviaBosnia and HerzegovinaBrazilBulgariaBurma/MyanmarCabo VerdeCambodiaCameroonCanadaCaribbeanCentral AmericaChileChinaColombiaCongoCosta RicaCroatiaCubaCzechoslovakiaDenmarkDominicaDominican RepublicEastern AfricaEastern AsiaEastern EuropeEcuadorEgyptEl SalvadorEnglandEritreaEthiopiaEuropeFijiFranceGermanyGhanaGreeceGrenadaGuatemalaGuyanaHaitiHondurasHong KongHungaryIndiaIndonesiaIranIraqIrelandIsraelItalyJamaicaJapanJordanKazakhstanKenyaKoreaKuwaitLaosLatin AmericaLatviaLebanonLiberiaLithuaniaMalaysiaMexicoMicronesiaMiddle AfricaMoldovaMoroccoNepalNetherlandsNicaraguaNigeriaNorth AmericaNorth MacedoniaNorthern AfricaNorthern EuropeNorwayOceaniaPakistanPanamaPeruPhilippinesPolandPortugalRomaniaRussiaSaudi ArabiaScotlandSenegalSerbiaSierra LeoneSingaporeSomaliaSouth AfricaSouth AmericaSouth Central AsiaSouth Eastern AsiaSouthern EuropeSpainSri LankaSt. Vincent and the GrenadinesSudanSwedenSwitzerlandSyriaTaiwanThailandTrinidad and TobagoTurkeyUgandaUkraineUruguayUzbekistanVenezuelaVietnamWest IndiesWestern AfricaWestern AsiaWestern EuropeYemenZaireZimbabweAzores
Cambodian
Race
Ancestry
AfghanAfricanAlaska NativeAlaskan AthabascanAlbanianAleutAlsatianAmericanApacheArabArapahoArgentineanArmenianAssyrian/Chaldean/SyriacAustralianAustrianBahamianBangladeshiBarbadianBasqueBelgianBelizeanBermudanBhutaneseBlackfeetBolivianBrazilianBritishBritish West IndianBulgarianBurmeseCajunCambodianCanadianCape VerdeanCarpatho RusynCelticCentral AmericanCentral American IndianCherokeeCheyenneChickasawChileanChineseChippewaChoctawColombianColvilleComancheCosta RicanCreeCreekCroatianCrowCubanCypriotCzechCzechoslovakianDanishDelawareDominicanDutchDutch West IndianEastern EuropeanEcuadorianEgyptianEnglishEstonianEthiopianEuropeanFijianFilipinoFinnishFrenchFrench American IndianFrench CanadianGermanGerman RussianGhanaianGreekGuamanian/ChamorroGuatemalanGuyaneseHaitianHmongHonduranHopiHoumaHungarianIcelanderIndian (Asian)IndonesianInupiatIranianIraqiIrishIroquoisIsraeliItalianJamaicanJapaneseJordanianKenyanKiowaKoreanLaotianLatvianLebaneseLiberianLithuanianLumbeeLuxembourgerMacedonianMalaysianMalteseMarshalleseMenomineeMexicanMexican American IndianMongolianMoroccanNative HawaiianNavajoNepaleseNew ZealanderNicaraguanNigerianNorthern EuropeanNorwegianOkinawanOsageOttawaPaiutePakistaniPalestinianPanamanianParaguayanPennsylvania GermanPeruvianPimaPolishPortuguesePotawatomiPuebloPuerto RicanPuget Sound SalishRomanianRussianSalvadoranSamoanScandinavianScotch-IrishScottishSeminoleSenegaleseSerbianShoshoneSierra LeoneanSiouxSlavicSlovakSloveneSomaliSouth AfricanSouth AmericanSouth American IndianSoviet UnionSpaniardSpanishSpanish AmericanSpanish American IndianSri LankanSubsaharan AfricanSudaneseSwedishSwissSyrianTaiwaneseThaiTlingit-HaidaTohono O'OdhamTonganTrinidadian and TobagonianTsimshianTurkishU.S. Virgin IslanderUgandanUkrainianUruguayanUteVenezuelanVietnameseWelshWest IndianYakamaYaquiYugoslavianYumanYup'ikZimbabwean
Immigration
NonimmigrantsImmigrantsAfghanistanAfricaAlbaniaArgentinaArmeniaAsiaAustraliaAustriaBahamasBangladeshBarbadosBelarusBelgiumBelizeBoliviaBosnia and HerzegovinaBrazilBulgariaBurma/MyanmarCabo VerdeCambodiaCameroonCanadaCaribbeanCentral AmericaChileChinaColombiaCongoCosta RicaCroatiaCubaCzechoslovakiaDenmarkDominicaDominican RepublicEastern AfricaEastern AsiaEastern EuropeEcuadorEgyptEl SalvadorEnglandEritreaEthiopiaEuropeFijiFranceGermanyGhanaGreeceGrenadaGuatemalaGuyanaHaitiHondurasHong KongHungaryIndiaIndonesiaIranIraqIrelandIsraelItalyJamaicaJapanJordanKazakhstanKenyaKoreaKuwaitLaosLatin AmericaLatviaLebanonLiberiaLithuaniaMalaysiaMexicoMicronesiaMiddle AfricaMoldovaMoroccoNepalNetherlandsNicaraguaNigeriaNorth AmericaNorth MacedoniaNorthern AfricaNorthern EuropeNorwayOceaniaPakistanPanamaPeruPhilippinesPolandPortugalRomaniaRussiaSaudi ArabiaScotlandSenegalSerbiaSierra LeoneSingaporeSomaliaSouth AfricaSouth AmericaSouth Central AsiaSouth Eastern AsiaSouthern EuropeSpainSri LankaSt. Vincent and the GrenadinesSudanSwedenSwitzerlandSyriaTaiwanThailandTrinidad and TobagoTurkeyUgandaUkraineUzbekistanVenezuelaVietnamWest IndiesWestern AfricaWestern AsiaWestern EuropeYemenZaireZimbabweAzores
Unemployment Among Ages 45 to 54 years
Income
Poverty
Unemployment
Labor Participation
Family Structure
Vehicle Availability
Education Level
Disability

Unemployment Among Ages 45 to 54 years Comparison

Immigrants from Uruguay

Cambodians

Fair
Exceptional
4.6%
UNEMPLOYMENT AMONG AGES 45 TO 54 YEARS
34.4/ 100
METRIC RATING
191st/ 347
METRIC RANK
4.3%
UNEMPLOYMENT AMONG AGES 45 TO 54 YEARS
97.8/ 100
METRIC RATING
80th/ 347
METRIC RANK

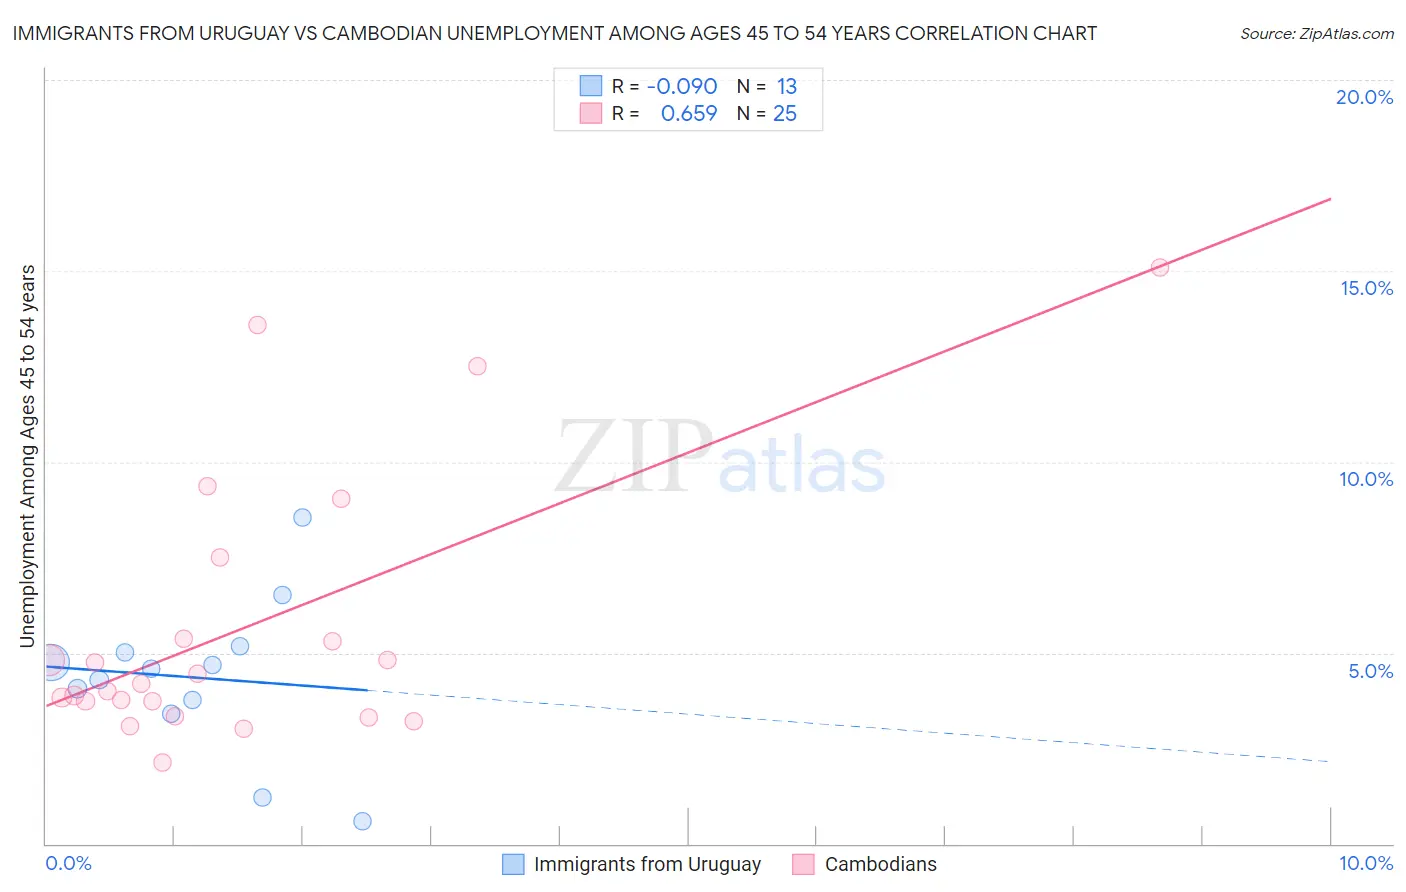
Immigrants from Uruguay vs Cambodian Unemployment Among Ages 45 to 54 years Correlation Chart

The statistical analysis conducted on geographies consisting of 132,497,849 people shows a slight negative correlation between the proportion of Immigrants from Uruguay and unemployment rate among population between the ages 45 and 54 in the United States with a correlation coefficient (R) of -0.090 and weighted average of 4.6%. Similarly, the statistical analysis conducted on geographies consisting of 101,933,246 people shows a significant positive correlation between the proportion of Cambodians and unemployment rate among population between the ages 45 and 54 in the United States with a correlation coefficient (R) of 0.659 and weighted average of 4.3%, a difference of 5.4%.
Immigrants from Uruguay vs Cambodian Unemployment Among Ages 45 to 54 years

Unemployment Among Ages 45 to 54 years Correlation Summary

MeasurementImmigrants from UruguayCambodian
Minimum0.60%2.1%
Maximum8.6%15.1%
Range8.0%13.0%
Mean4.4%5.7%
Median4.6%4.2%
Interquartile 25% (IQ1)3.6%3.5%
Interquartile 75% (IQ3)5.1%6.4%
Interquartile Range (IQR)1.5%2.9%
Standard Deviation (Sample)2.0%3.5%
Standard Deviation (Population)1.9%3.4%

Similar Demographics by Unemployment Among Ages 45 to 54 years

Demographics Similar to Immigrants from Uruguay by Unemployment Among Ages 45 to 54 years

In terms of unemployment among ages 45 to 54 years, the demographic groups most similar to Immigrants from Uruguay are Immigrants from Serbia (4.6%, a difference of 0.020%), Immigrants from Thailand (4.6%, a difference of 0.020%), Immigrants from Lithuania (4.6%, a difference of 0.060%), Immigrants from Laos (4.6%, a difference of 0.070%), and South American (4.6%, a difference of 0.080%).
DemographicsRating | RankUnemployment Among Ages 45 to 54 years
Immigrants | Hong Kong
45.9
/100
|
#184
Average
4.5%
Immigrants | Philippines
41.0
/100
|
#185
Average
4.5%
Hawaiians
39.1
/100
|
#186
Fair
4.5%
Immigrants | Ukraine
36.8
/100
|
#187
Fair
4.5%
Immigrants | Sierra Leone
36.3
/100
|
#188
Fair
4.6%
Immigrants | Laos
35.7
/100
|
#189
Fair
4.6%
Immigrants | Serbia
34.8
/100
|
#190
Fair
4.6%
Immigrants | Uruguay
34.4
/100
|
#191
Fair
4.6%
Immigrants | Thailand
34.1
/100
|
#192
Fair
4.6%
Immigrants | Lithuania
33.2
/100
|
#193
Fair
4.6%
South Americans
32.9
/100
|
#194
Fair
4.6%
Peruvians
31.5
/100
|
#195
Fair
4.6%
Estonians
31.2
/100
|
#196
Fair
4.6%
Albanians
31.1
/100
|
#197
Fair
4.6%
Immigrants | Belarus
30.6
/100
|
#198
Fair
4.6%

Demographics Similar to Cambodians by Unemployment Among Ages 45 to 54 years

In terms of unemployment among ages 45 to 54 years, the demographic groups most similar to Cambodians are Serbian (4.3%, a difference of 0.060%), German Russian (4.3%, a difference of 0.070%), Immigrants from Micronesia (4.3%, a difference of 0.090%), Eastern European (4.3%, a difference of 0.12%), and Chilean (4.3%, a difference of 0.16%).
DemographicsRating | RankUnemployment Among Ages 45 to 54 years
Canadians
98.2
/100
|
#73
Exceptional
4.3%
Immigrants | Belgium
98.2
/100
|
#74
Exceptional
4.3%
Kenyans
98.1
/100
|
#75
Exceptional
4.3%
Slavs
98.1
/100
|
#76
Exceptional
4.3%
Chileans
98.1
/100
|
#77
Exceptional
4.3%
German Russians
97.9
/100
|
#78
Exceptional
4.3%
Serbians
97.9
/100
|
#79
Exceptional
4.3%
Cambodians
97.8
/100
|
#80
Exceptional
4.3%
Immigrants | Micronesia
97.6
/100
|
#81
Exceptional
4.3%
Eastern Europeans
97.6
/100
|
#82
Exceptional
4.3%
Australians
97.4
/100
|
#83
Exceptional
4.3%
Italians
97.3
/100
|
#84
Exceptional
4.3%
French
97.3
/100
|
#85
Exceptional
4.3%
Ethiopians
97.2
/100
|
#86
Exceptional
4.3%
Sudanese
97.0
/100
|
#87
Exceptional
4.3%