Immigrants from El Salvador vs Cambodian Unemployment Among Ages 45 to 54 years
COMPARE
Immigrants from El Salvador
Cambodian
Unemployment Among Ages 45 to 54 years
Unemployment Among Ages 45 to 54 years Comparison
Immigrants from El Salvador
Cambodians
4.8%
UNEMPLOYMENT AMONG AGES 45 TO 54 YEARS
0.2/ 100
METRIC RATING
255th/ 347
METRIC RANK
4.3%
UNEMPLOYMENT AMONG AGES 45 TO 54 YEARS
97.8/ 100
METRIC RATING
80th/ 347
METRIC RANK
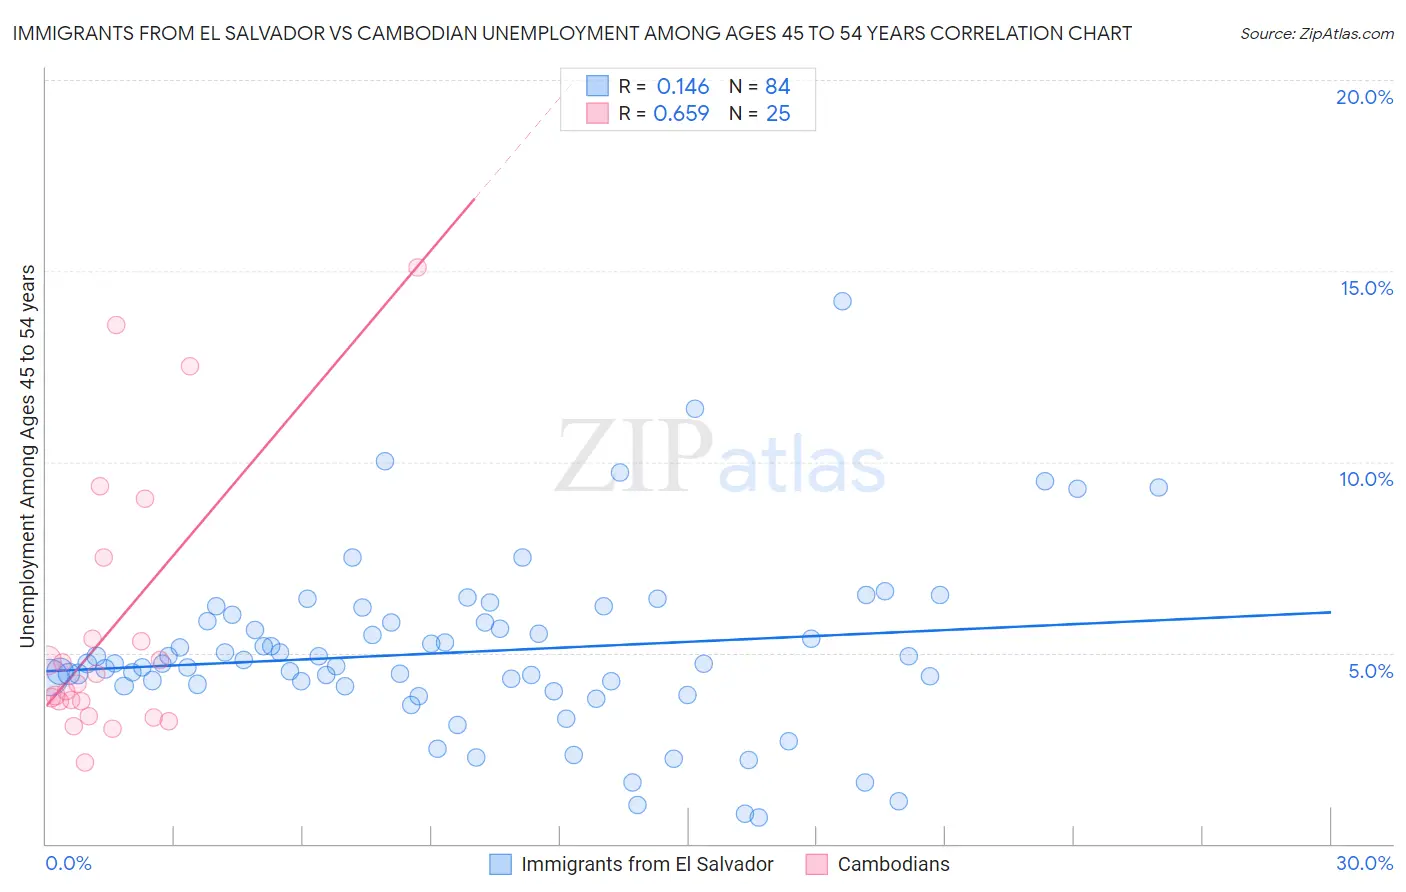
Immigrants from El Salvador vs Cambodian Unemployment Among Ages 45 to 54 years Correlation Chart
The statistical analysis conducted on geographies consisting of 350,418,363 people shows a poor positive correlation between the proportion of Immigrants from El Salvador and unemployment rate among population between the ages 45 and 54 in the United States with a correlation coefficient (R) of 0.146 and weighted average of 4.8%. Similarly, the statistical analysis conducted on geographies consisting of 101,933,246 people shows a significant positive correlation between the proportion of Cambodians and unemployment rate among population between the ages 45 and 54 in the United States with a correlation coefficient (R) of 0.659 and weighted average of 4.3%, a difference of 12.1%.
Unemployment Among Ages 45 to 54 years Correlation Summary
| Measurement | Immigrants from El Salvador | Cambodian |
| Minimum | 0.70% | 2.1% |
| Maximum | 14.2% | 15.1% |
| Range | 13.5% | 13.0% |
| Mean | 5.0% | 5.7% |
| Median | 4.7% | 4.2% |
| Interquartile 25% (IQ1) | 4.2% | 3.5% |
| Interquartile 75% (IQ3) | 5.8% | 6.4% |
| Interquartile Range (IQR) | 1.7% | 2.9% |
| Standard Deviation (Sample) | 2.3% | 3.5% |
| Standard Deviation (Population) | 2.2% | 3.4% |
Similar Demographics by Unemployment Among Ages 45 to 54 years
Demographics Similar to Immigrants from El Salvador by Unemployment Among Ages 45 to 54 years
In terms of unemployment among ages 45 to 54 years, the demographic groups most similar to Immigrants from El Salvador are Immigrants from Western Asia (4.8%, a difference of 0.080%), Immigrants from Lebanon (4.8%, a difference of 0.13%), Immigrants from Western Africa (4.9%, a difference of 0.22%), Subsaharan African (4.9%, a difference of 0.26%), and Moroccan (4.8%, a difference of 0.35%).
| Demographics | Rating | Rank | Unemployment Among Ages 45 to 54 years |
| Immigrants | Liberia | 0.8 /100 | #248 | Tragic 4.8% |
| Immigrants | Honduras | 0.7 /100 | #249 | Tragic 4.8% |
| Salvadorans | 0.7 /100 | #250 | Tragic 4.8% |
| Hondurans | 0.4 /100 | #251 | Tragic 4.8% |
| Immigrants | Bahamas | 0.3 /100 | #252 | Tragic 4.8% |
| Moroccans | 0.3 /100 | #253 | Tragic 4.8% |
| Immigrants | Lebanon | 0.2 /100 | #254 | Tragic 4.8% |
| Immigrants | El Salvador | 0.2 /100 | #255 | Tragic 4.8% |
| Immigrants | Western Asia | 0.2 /100 | #256 | Tragic 4.8% |
| Immigrants | Western Africa | 0.2 /100 | #257 | Tragic 4.9% |
| Sub-Saharan Africans | 0.2 /100 | #258 | Tragic 4.9% |
| Ugandans | 0.1 /100 | #259 | Tragic 4.9% |
| Mexican American Indians | 0.1 /100 | #260 | Tragic 4.9% |
| Guatemalans | 0.1 /100 | #261 | Tragic 4.9% |
| Mexicans | 0.1 /100 | #262 | Tragic 4.9% |
Demographics Similar to Cambodians by Unemployment Among Ages 45 to 54 years
In terms of unemployment among ages 45 to 54 years, the demographic groups most similar to Cambodians are Serbian (4.3%, a difference of 0.060%), German Russian (4.3%, a difference of 0.070%), Immigrants from Micronesia (4.3%, a difference of 0.090%), Eastern European (4.3%, a difference of 0.12%), and Chilean (4.3%, a difference of 0.16%).
| Demographics | Rating | Rank | Unemployment Among Ages 45 to 54 years |
| Canadians | 98.2 /100 | #73 | Exceptional 4.3% |
| Immigrants | Belgium | 98.2 /100 | #74 | Exceptional 4.3% |
| Kenyans | 98.1 /100 | #75 | Exceptional 4.3% |
| Slavs | 98.1 /100 | #76 | Exceptional 4.3% |
| Chileans | 98.1 /100 | #77 | Exceptional 4.3% |
| German Russians | 97.9 /100 | #78 | Exceptional 4.3% |
| Serbians | 97.9 /100 | #79 | Exceptional 4.3% |
| Cambodians | 97.8 /100 | #80 | Exceptional 4.3% |
| Immigrants | Micronesia | 97.6 /100 | #81 | Exceptional 4.3% |
| Eastern Europeans | 97.6 /100 | #82 | Exceptional 4.3% |
| Australians | 97.4 /100 | #83 | Exceptional 4.3% |
| Italians | 97.3 /100 | #84 | Exceptional 4.3% |
| French | 97.3 /100 | #85 | Exceptional 4.3% |
| Ethiopians | 97.2 /100 | #86 | Exceptional 4.3% |
| Sudanese | 97.0 /100 | #87 | Exceptional 4.3% |