Immigrants from Ukraine vs Immigrants from Congo Unemployment Among Ages 35 to 44 years
COMPARE
Immigrants from Ukraine
Immigrants from Congo
Unemployment Among Ages 35 to 44 years
Unemployment Among Ages 35 to 44 years Comparison
Immigrants from Ukraine
Immigrants from Congo
4.8%
UNEMPLOYMENT AMONG AGES 35 TO 44 YEARS
21.4/ 100
METRIC RATING
200th/ 347
METRIC RANK
4.7%
UNEMPLOYMENT AMONG AGES 35 TO 44 YEARS
33.9/ 100
METRIC RATING
189th/ 347
METRIC RANK
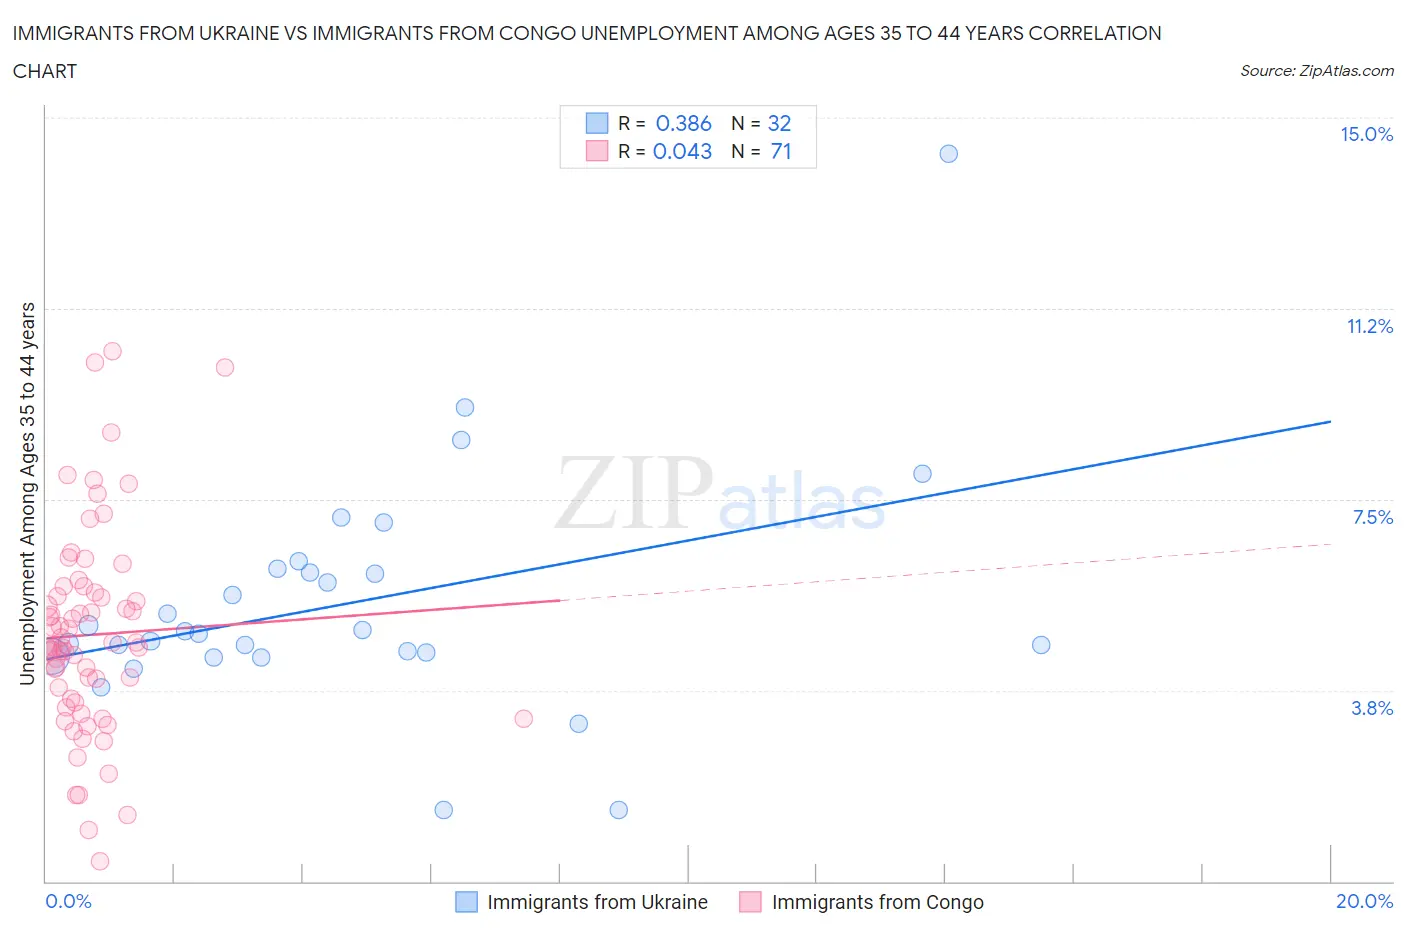
Immigrants from Ukraine vs Immigrants from Congo Unemployment Among Ages 35 to 44 years Correlation Chart
The statistical analysis conducted on geographies consisting of 285,095,917 people shows a mild positive correlation between the proportion of Immigrants from Ukraine and unemployment rate among population between the ages 35 and 44 in the United States with a correlation coefficient (R) of 0.386 and weighted average of 4.8%. Similarly, the statistical analysis conducted on geographies consisting of 91,826,313 people shows no correlation between the proportion of Immigrants from Congo and unemployment rate among population between the ages 35 and 44 in the United States with a correlation coefficient (R) of 0.043 and weighted average of 4.7%, a difference of 1.1%.
Unemployment Among Ages 35 to 44 years Correlation Summary
| Measurement | Immigrants from Ukraine | Immigrants from Congo |
| Minimum | 1.4% | 0.40% |
| Maximum | 14.3% | 10.4% |
| Range | 12.9% | 10.0% |
| Mean | 5.5% | 4.8% |
| Median | 4.9% | 4.6% |
| Interquartile 25% (IQ1) | 4.5% | 3.5% |
| Interquartile 75% (IQ3) | 6.1% | 5.7% |
| Interquartile Range (IQR) | 1.7% | 2.2% |
| Standard Deviation (Sample) | 2.3% | 2.0% |
| Standard Deviation (Population) | 2.3% | 2.0% |
Demographics Similar to Immigrants from Ukraine and Immigrants from Congo by Unemployment Among Ages 35 to 44 years
In terms of unemployment among ages 35 to 44 years, the demographic groups most similar to Immigrants from Ukraine are Ugandan (4.8%, a difference of 0.0%), Immigrants from Middle Africa (4.8%, a difference of 0.050%), Immigrants from Afghanistan (4.8%, a difference of 0.13%), Immigrants from Thailand (4.8%, a difference of 0.15%), and Uruguayan (4.8%, a difference of 0.15%). Similarly, the demographic groups most similar to Immigrants from Congo are Immigrants from Southern Europe (4.7%, a difference of 0.010%), Immigrants from South America (4.7%, a difference of 0.010%), Immigrants from Laos (4.7%, a difference of 0.040%), Malaysian (4.7%, a difference of 0.12%), and Cypriot (4.7%, a difference of 0.19%).
| Demographics | Rating | Rank | Unemployment Among Ages 35 to 44 years |
| Immigrants | Zaire | 37.3 /100 | #184 | Fair 4.7% |
| Immigrants | Costa Rica | 37.0 /100 | #185 | Fair 4.7% |
| Cypriots | 36.5 /100 | #186 | Fair 4.7% |
| Malaysians | 35.5 /100 | #187 | Fair 4.7% |
| Immigrants | Laos | 34.5 /100 | #188 | Fair 4.7% |
| Immigrants | Congo | 33.9 /100 | #189 | Fair 4.7% |
| Immigrants | Southern Europe | 33.8 /100 | #190 | Fair 4.7% |
| Immigrants | South America | 33.8 /100 | #191 | Fair 4.7% |
| Immigrants | Albania | 30.5 /100 | #192 | Fair 4.8% |
| Spanish | 30.4 /100 | #193 | Fair 4.8% |
| Koreans | 28.1 /100 | #194 | Fair 4.8% |
| Bangladeshis | 28.0 /100 | #195 | Fair 4.8% |
| Immigrants | Syria | 23.6 /100 | #196 | Fair 4.8% |
| Immigrants | Oceania | 23.2 /100 | #197 | Fair 4.8% |
| Immigrants | Thailand | 22.9 /100 | #198 | Fair 4.8% |
| Immigrants | Middle Africa | 21.9 /100 | #199 | Fair 4.8% |
| Immigrants | Ukraine | 21.4 /100 | #200 | Fair 4.8% |
| Ugandans | 21.4 /100 | #201 | Fair 4.8% |
| Immigrants | Afghanistan | 20.2 /100 | #202 | Fair 4.8% |
| Uruguayans | 20.0 /100 | #203 | Fair 4.8% |
| Immigrants | Philippines | 19.8 /100 | #204 | Poor 4.8% |