Immigrants from Ireland vs Immigrants from Congo Unemployment Among Ages 35 to 44 years

COMPARE

Immigrants from Ireland
Race
Ancestry
AfghanAfricanAlaska NativeAlaskan AthabascanAlbanianAleutAlsatianAmericanApacheArabArapahoArgentineanArmenianAssyrian/Chaldean/SyriacAustralianAustrianBahamianBangladeshiBarbadianBasqueBelgianBelizeanBermudanBhutaneseBlackfeetBolivianBrazilianBritishBritish West IndianBulgarianBurmeseCajunCambodianCanadianCape VerdeanCarpatho RusynCelticCentral AmericanCentral American IndianCherokeeCheyenneChickasawChileanChineseChippewaChoctawColombianColvilleComancheCosta RicanCreeCreekCroatianCrowCubanCypriotCzechCzechoslovakianDanishDelawareDominicanDutchDutch West IndianEastern EuropeanEcuadorianEgyptianEnglishEstonianEthiopianEuropeanFijianFilipinoFinnishFrenchFrench American IndianFrench CanadianGermanGerman RussianGhanaianGreekGuamanian/ChamorroGuatemalanGuyaneseHaitianHmongHonduranHopiHoumaHungarianIcelanderIndian (Asian)IndonesianInupiatIranianIraqiIrishIroquoisIsraeliItalianJamaicanJapaneseJordanianKenyanKiowaKoreanLaotianLatvianLebaneseLiberianLithuanianLumbeeLuxembourgerMacedonianMalaysianMalteseMarshalleseMenomineeMexicanMexican American IndianMongolianMoroccanNative HawaiianNavajoNepaleseNew ZealanderNicaraguanNigerianNorthern EuropeanNorwegianOkinawanOsageOttawaPaiutePakistaniPalestinianPanamanianParaguayanPennsylvania GermanPeruvianPimaPolishPortuguesePotawatomiPuebloPuerto RicanPuget Sound SalishRomanianRussianSalvadoranSamoanScandinavianScotch-IrishScottishSeminoleSenegaleseSerbianShoshoneSierra LeoneanSiouxSlavicSlovakSloveneSomaliSouth AfricanSouth AmericanSouth American IndianSoviet UnionSpaniardSpanishSpanish AmericanSpanish American IndianSri LankanSubsaharan AfricanSudaneseSwedishSwissSyrianTaiwaneseThaiTlingit-HaidaTohono O'OdhamTonganTrinidadian and TobagonianTsimshianTurkishU.S. Virgin IslanderUgandanUkrainianUruguayanUteVenezuelanVietnameseWelshWest IndianYakamaYaquiYugoslavianYumanYup'ikZimbabwean
Immigration
NonimmigrantsImmigrantsAfghanistanAfricaAlbaniaArgentinaArmeniaAsiaAustraliaAustriaBahamasBangladeshBarbadosBelarusBelgiumBelizeBoliviaBosnia and HerzegovinaBrazilBulgariaBurma/MyanmarCabo VerdeCambodiaCameroonCanadaCaribbeanCentral AmericaChileChinaColombiaCosta RicaCroatiaCubaCzechoslovakiaDenmarkDominicaDominican RepublicEastern AfricaEastern AsiaEastern EuropeEcuadorEgyptEl SalvadorEnglandEritreaEthiopiaEuropeFijiFranceGermanyGhanaGreeceGrenadaGuatemalaGuyanaHaitiHondurasHong KongHungaryIndiaIndonesiaIranIraqIrelandIsraelItalyJamaicaJapanJordanKazakhstanKenyaKoreaKuwaitLaosLatin AmericaLatviaLebanonLiberiaLithuaniaMalaysiaMexicoMicronesiaMiddle AfricaMoldovaMoroccoNepalNetherlandsNicaraguaNigeriaNorth AmericaNorth MacedoniaNorthern AfricaNorthern EuropeNorwayOceaniaPakistanPanamaPeruPhilippinesPolandPortugalRomaniaRussiaSaudi ArabiaScotlandSenegalSerbiaSierra LeoneSingaporeSomaliaSouth AfricaSouth AmericaSouth Central AsiaSouth Eastern AsiaSouthern EuropeSpainSri LankaSt. Vincent and the GrenadinesSudanSwedenSwitzerlandSyriaTaiwanThailandTrinidad and TobagoTurkeyUgandaUkraineUruguayUzbekistanVenezuelaVietnamWest IndiesWestern AfricaWestern AsiaWestern EuropeYemenZaireZimbabweAzores
Immigrants from Congo
Race
Ancestry
AfghanAfricanAlaska NativeAlaskan AthabascanAlbanianAleutAlsatianAmericanApacheArabArapahoArgentineanArmenianAssyrian/Chaldean/SyriacAustralianAustrianBahamianBangladeshiBarbadianBasqueBelgianBelizeanBermudanBhutaneseBlackfeetBolivianBrazilianBritishBritish West IndianBulgarianBurmeseCajunCambodianCanadianCape VerdeanCarpatho RusynCelticCentral AmericanCentral American IndianCherokeeCheyenneChickasawChileanChineseChippewaChoctawColombianColvilleComancheCosta RicanCreeCreekCroatianCrowCubanCypriotCzechCzechoslovakianDanishDelawareDominicanDutchDutch West IndianEastern EuropeanEcuadorianEgyptianEnglishEstonianEthiopianEuropeanFijianFilipinoFinnishFrenchFrench American IndianFrench CanadianGermanGerman RussianGhanaianGreekGuamanian/ChamorroGuatemalanGuyaneseHaitianHmongHonduranHopiHoumaHungarianIcelanderIndian (Asian)IndonesianInupiatIranianIraqiIrishIroquoisIsraeliItalianJamaicanJapaneseJordanianKenyanKiowaKoreanLaotianLatvianLebaneseLiberianLithuanianLumbeeLuxembourgerMacedonianMalaysianMalteseMarshalleseMenomineeMexicanMexican American IndianMongolianMoroccanNative HawaiianNavajoNepaleseNew ZealanderNicaraguanNigerianNorthern EuropeanNorwegianOkinawanOsageOttawaPaiutePakistaniPalestinianPanamanianParaguayanPennsylvania GermanPeruvianPimaPolishPortuguesePotawatomiPuebloPuerto RicanPuget Sound SalishRomanianRussianSalvadoranSamoanScandinavianScotch-IrishScottishSeminoleSenegaleseSerbianShoshoneSierra LeoneanSiouxSlavicSlovakSloveneSomaliSouth AfricanSouth AmericanSouth American IndianSoviet UnionSpaniardSpanishSpanish AmericanSpanish American IndianSri LankanSubsaharan AfricanSudaneseSwedishSwissSyrianTaiwaneseThaiTlingit-HaidaTohono O'OdhamTonganTrinidadian and TobagonianTsimshianTurkishU.S. Virgin IslanderUgandanUkrainianUruguayanUteVenezuelanVietnameseWelshWest IndianYakamaYaquiYugoslavianYumanYup'ikZimbabwean
Immigration
NonimmigrantsImmigrantsAfghanistanAfricaAlbaniaArgentinaArmeniaAsiaAustraliaAustriaBahamasBangladeshBarbadosBelarusBelgiumBelizeBoliviaBosnia and HerzegovinaBrazilBulgariaBurma/MyanmarCabo VerdeCambodiaCameroonCanadaCaribbeanCentral AmericaChileChinaColombiaCongoCosta RicaCroatiaCubaCzechoslovakiaDenmarkDominicaDominican RepublicEastern AfricaEastern AsiaEastern EuropeEcuadorEgyptEl SalvadorEnglandEritreaEthiopiaEuropeFijiFranceGermanyGhanaGreeceGrenadaGuatemalaGuyanaHaitiHondurasHong KongHungaryIndiaIndonesiaIranIraqIsraelItalyJamaicaJapanJordanKazakhstanKenyaKoreaKuwaitLaosLatin AmericaLatviaLebanonLiberiaLithuaniaMalaysiaMexicoMicronesiaMiddle AfricaMoldovaMoroccoNepalNetherlandsNicaraguaNigeriaNorth AmericaNorth MacedoniaNorthern AfricaNorthern EuropeNorwayOceaniaPakistanPanamaPeruPhilippinesPolandPortugalRomaniaRussiaSaudi ArabiaScotlandSenegalSerbiaSierra LeoneSingaporeSomaliaSouth AfricaSouth AmericaSouth Central AsiaSouth Eastern AsiaSouthern EuropeSpainSri LankaSt. Vincent and the GrenadinesSudanSwedenSwitzerlandSyriaTaiwanThailandTrinidad and TobagoTurkeyUgandaUkraineUruguayUzbekistanVenezuelaVietnamWest IndiesWestern AfricaWestern AsiaWestern EuropeYemenZaireZimbabweAzores
Unemployment Among Ages 35 to 44 years
Income
Poverty
Unemployment
Labor Participation
Family Structure
Vehicle Availability
Education Level
Disability

Unemployment Among Ages 35 to 44 years Comparison

Immigrants from Ireland

Immigrants from Congo

Exceptional
Fair
4.4%
UNEMPLOYMENT AMONG AGES 35 TO 44 YEARS
96.8/ 100
METRIC RATING
68th/ 347
METRIC RANK
4.7%
UNEMPLOYMENT AMONG AGES 35 TO 44 YEARS
33.9/ 100
METRIC RATING
189th/ 347
METRIC RANK

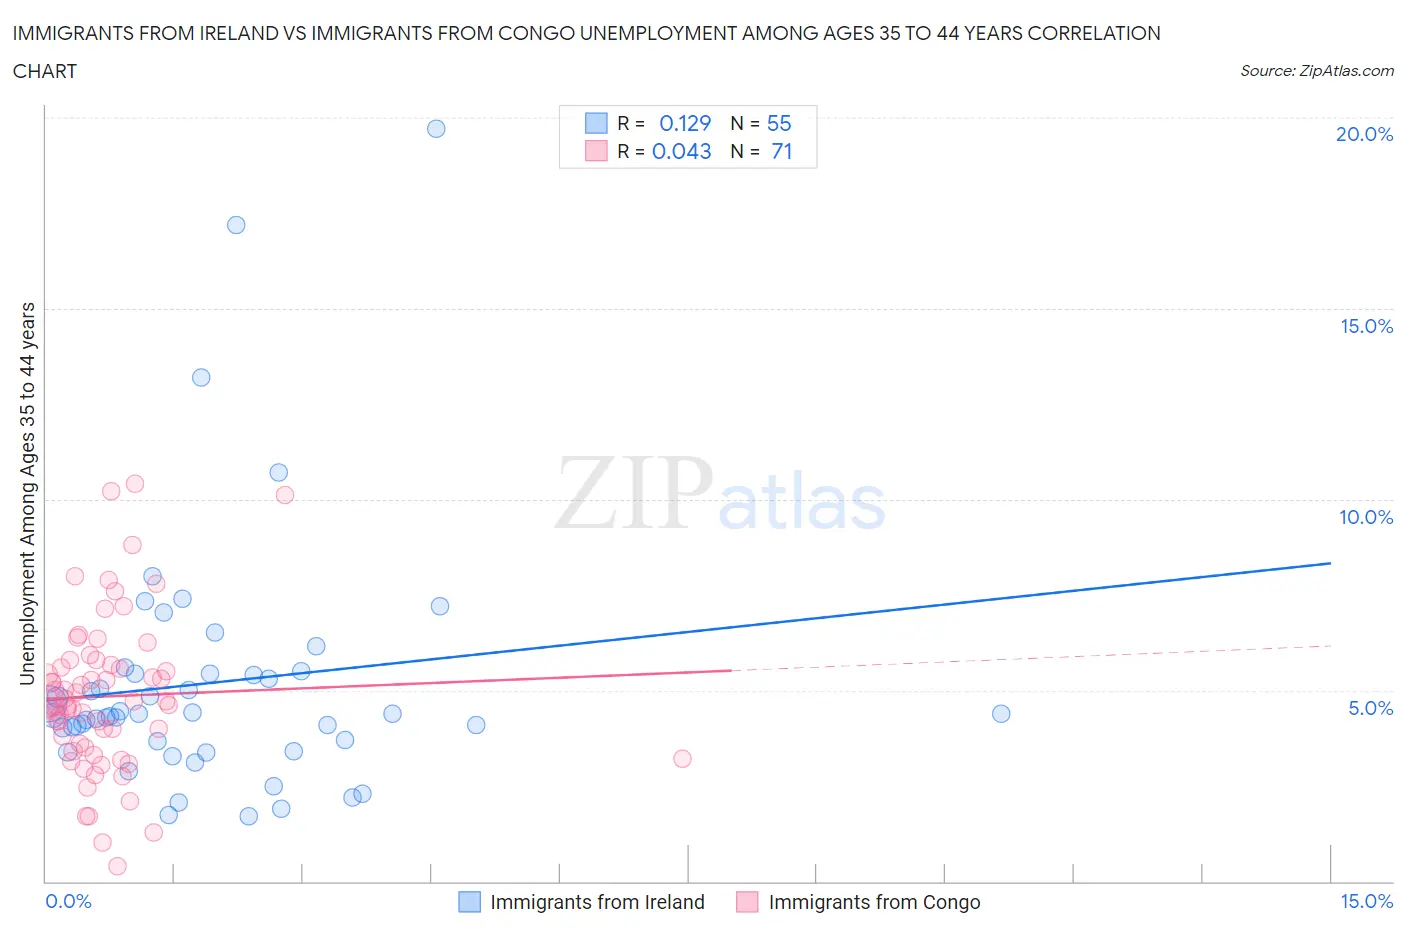
Immigrants from Ireland vs Immigrants from Congo Unemployment Among Ages 35 to 44 years Correlation Chart

The statistical analysis conducted on geographies consisting of 237,282,252 people shows a poor positive correlation between the proportion of Immigrants from Ireland and unemployment rate among population between the ages 35 and 44 in the United States with a correlation coefficient (R) of 0.129 and weighted average of 4.4%. Similarly, the statistical analysis conducted on geographies consisting of 91,826,313 people shows no correlation between the proportion of Immigrants from Congo and unemployment rate among population between the ages 35 and 44 in the United States with a correlation coefficient (R) of 0.043 and weighted average of 4.7%, a difference of 7.7%.
Immigrants from Ireland vs Immigrants from Congo Unemployment Among Ages 35 to 44 years

Unemployment Among Ages 35 to 44 years Correlation Summary

MeasurementImmigrants from IrelandImmigrants from Congo
Minimum1.7%0.40%
Maximum19.7%10.4%
Range18.0%10.0%
Mean5.2%4.8%
Median4.4%4.6%
Interquartile 25% (IQ1)3.7%3.5%
Interquartile 75% (IQ3)5.4%5.7%
Interquartile Range (IQR)1.8%2.2%
Standard Deviation (Sample)3.3%2.0%
Standard Deviation (Population)3.3%2.0%

Similar Demographics by Unemployment Among Ages 35 to 44 years

Demographics Similar to Immigrants from Ireland by Unemployment Among Ages 35 to 44 years

In terms of unemployment among ages 35 to 44 years, the demographic groups most similar to Immigrants from Ireland are Icelander (4.4%, a difference of 0.010%), Argentinean (4.4%, a difference of 0.010%), Slovene (4.4%, a difference of 0.060%), Immigrants from China (4.4%, a difference of 0.060%), and Immigrants from Lithuania (4.4%, a difference of 0.070%).
DemographicsRating | RankUnemployment Among Ages 35 to 44 years
Croatians
97.1
/100
|
#61
Exceptional
4.4%
Immigrants | Bulgaria
97.1
/100
|
#62
Exceptional
4.4%
Austrians
97.1
/100
|
#63
Exceptional
4.4%
Immigrants | Serbia
97.0
/100
|
#64
Exceptional
4.4%
Cambodians
97.0
/100
|
#65
Exceptional
4.4%
Icelanders
96.8
/100
|
#66
Exceptional
4.4%
Argentineans
96.8
/100
|
#67
Exceptional
4.4%
Immigrants | Ireland
96.8
/100
|
#68
Exceptional
4.4%
Slovenes
96.7
/100
|
#69
Exceptional
4.4%
Immigrants | China
96.7
/100
|
#70
Exceptional
4.4%
Immigrants | Lithuania
96.7
/100
|
#71
Exceptional
4.4%
Northern Europeans
96.5
/100
|
#72
Exceptional
4.4%
Lithuanians
96.5
/100
|
#73
Exceptional
4.4%
Poles
96.4
/100
|
#74
Exceptional
4.4%
Immigrants | Romania
96.3
/100
|
#75
Exceptional
4.4%

Demographics Similar to Immigrants from Congo by Unemployment Among Ages 35 to 44 years

In terms of unemployment among ages 35 to 44 years, the demographic groups most similar to Immigrants from Congo are Immigrants from Southern Europe (4.7%, a difference of 0.010%), Immigrants from South America (4.7%, a difference of 0.010%), Immigrants from Laos (4.7%, a difference of 0.040%), Malaysian (4.7%, a difference of 0.12%), and Cypriot (4.7%, a difference of 0.19%).
DemographicsRating | RankUnemployment Among Ages 35 to 44 years
Israelis
38.5
/100
|
#182
Fair
4.7%
Immigrants | Poland
37.9
/100
|
#183
Fair
4.7%
Immigrants | Zaire
37.3
/100
|
#184
Fair
4.7%
Immigrants | Costa Rica
37.0
/100
|
#185
Fair
4.7%
Cypriots
36.5
/100
|
#186
Fair
4.7%
Malaysians
35.5
/100
|
#187
Fair
4.7%
Immigrants | Laos
34.5
/100
|
#188
Fair
4.7%
Immigrants | Congo
33.9
/100
|
#189
Fair
4.7%
Immigrants | Southern Europe
33.8
/100
|
#190
Fair
4.7%
Immigrants | South America
33.8
/100
|
#191
Fair
4.7%
Immigrants | Albania
30.5
/100
|
#192
Fair
4.8%
Spanish
30.4
/100
|
#193
Fair
4.8%
Koreans
28.1
/100
|
#194
Fair
4.8%
Bangladeshis
28.0
/100
|
#195
Fair
4.8%
Immigrants | Syria
23.6
/100
|
#196
Fair
4.8%