Immigrants from Uganda vs Ottawa Unemployment Among Ages 35 to 44 years
COMPARE
Immigrants from Uganda
Ottawa
Unemployment Among Ages 35 to 44 years
Unemployment Among Ages 35 to 44 years Comparison
Immigrants from Uganda
Ottawa
4.7%
UNEMPLOYMENT AMONG AGES 35 TO 44 YEARS
48.1/ 100
METRIC RATING
176th/ 347
METRIC RANK
5.6%
UNEMPLOYMENT AMONG AGES 35 TO 44 YEARS
0.0/ 100
METRIC RATING
295th/ 347
METRIC RANK
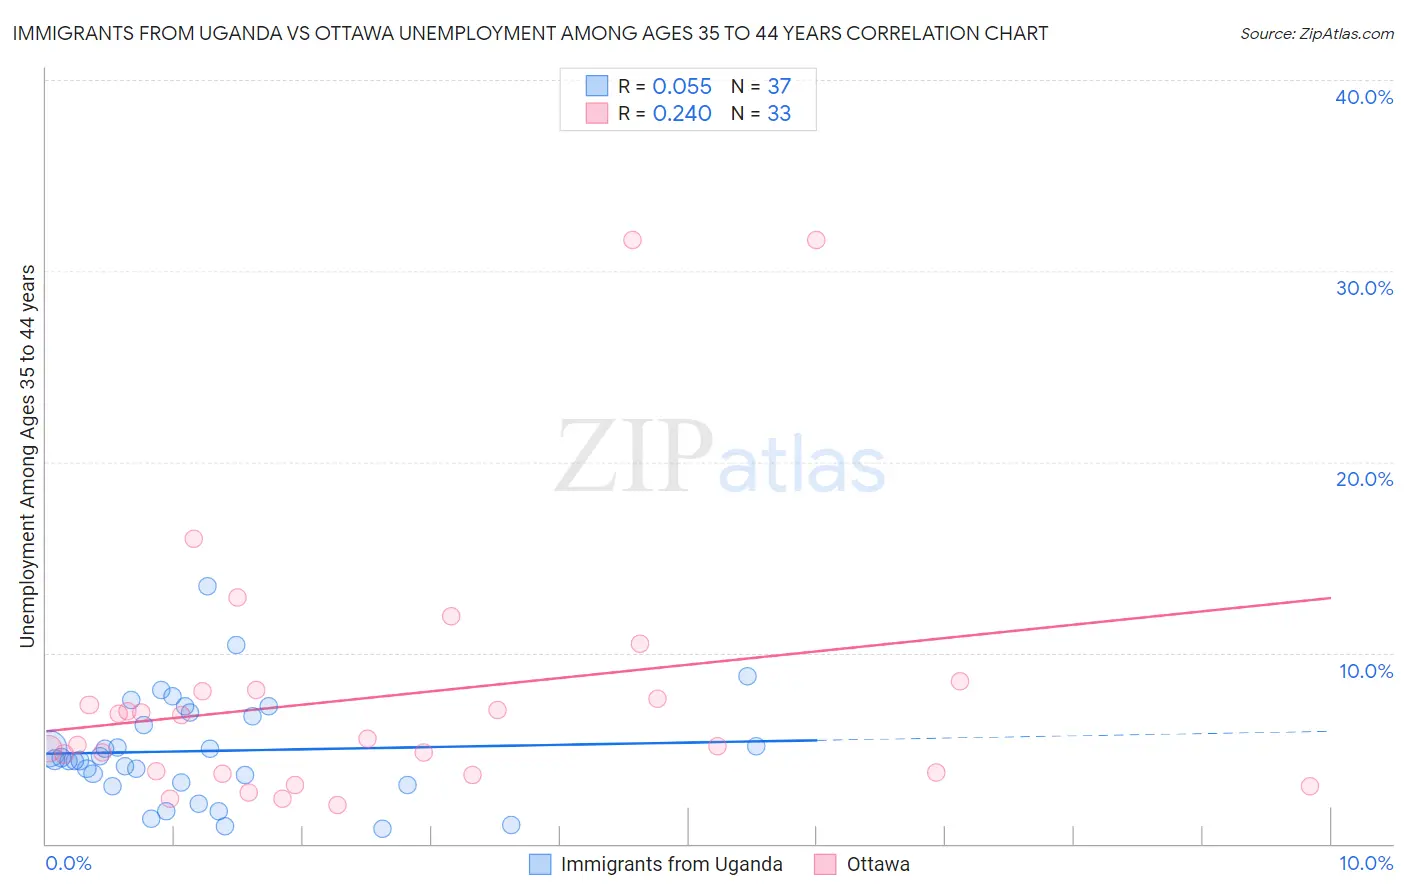
Immigrants from Uganda vs Ottawa Unemployment Among Ages 35 to 44 years Correlation Chart
The statistical analysis conducted on geographies consisting of 125,256,740 people shows a slight positive correlation between the proportion of Immigrants from Uganda and unemployment rate among population between the ages 35 and 44 in the United States with a correlation coefficient (R) of 0.055 and weighted average of 4.7%. Similarly, the statistical analysis conducted on geographies consisting of 49,559,815 people shows a weak positive correlation between the proportion of Ottawa and unemployment rate among population between the ages 35 and 44 in the United States with a correlation coefficient (R) of 0.240 and weighted average of 5.6%, a difference of 18.6%.
Unemployment Among Ages 35 to 44 years Correlation Summary
| Measurement | Immigrants from Uganda | Ottawa |
| Minimum | 0.80% | 2.0% |
| Maximum | 13.5% | 31.6% |
| Range | 12.7% | 29.6% |
| Mean | 4.9% | 7.7% |
| Median | 4.4% | 5.5% |
| Interquartile 25% (IQ1) | 3.2% | 3.7% |
| Interquartile 75% (IQ3) | 6.8% | 8.0% |
| Interquartile Range (IQR) | 3.6% | 4.3% |
| Standard Deviation (Sample) | 2.7% | 6.9% |
| Standard Deviation (Population) | 2.7% | 6.8% |
Similar Demographics by Unemployment Among Ages 35 to 44 years
Demographics Similar to Immigrants from Uganda by Unemployment Among Ages 35 to 44 years
In terms of unemployment among ages 35 to 44 years, the demographic groups most similar to Immigrants from Uganda are Immigrants from Germany (4.7%, a difference of 0.060%), Afghan (4.7%, a difference of 0.14%), Iraqi (4.7%, a difference of 0.20%), Lebanese (4.7%, a difference of 0.23%), and Slovak (4.7%, a difference of 0.25%).
| Demographics | Rating | Rank | Unemployment Among Ages 35 to 44 years |
| Pennsylvania Germans | 53.0 /100 | #169 | Average 4.7% |
| Immigrants | Indonesia | 52.6 /100 | #170 | Average 4.7% |
| Indonesians | 51.7 /100 | #171 | Average 4.7% |
| Lebanese | 51.4 /100 | #172 | Average 4.7% |
| Iraqis | 50.9 /100 | #173 | Average 4.7% |
| Afghans | 50.0 /100 | #174 | Average 4.7% |
| Immigrants | Germany | 48.9 /100 | #175 | Average 4.7% |
| Immigrants | Uganda | 48.1 /100 | #176 | Average 4.7% |
| Slovaks | 44.6 /100 | #177 | Average 4.7% |
| South American Indians | 40.7 /100 | #178 | Average 4.7% |
| Immigrants | South Eastern Asia | 40.2 /100 | #179 | Average 4.7% |
| Immigrants | Peru | 39.9 /100 | #180 | Fair 4.7% |
| Brazilians | 39.5 /100 | #181 | Fair 4.7% |
| Israelis | 38.5 /100 | #182 | Fair 4.7% |
| Immigrants | Poland | 37.9 /100 | #183 | Fair 4.7% |
Demographics Similar to Ottawa by Unemployment Among Ages 35 to 44 years
In terms of unemployment among ages 35 to 44 years, the demographic groups most similar to Ottawa are Immigrants from Trinidad and Tobago (5.6%, a difference of 0.020%), U.S. Virgin Islander (5.6%, a difference of 0.12%), Aleut (5.6%, a difference of 0.13%), Trinidadian and Tobagonian (5.6%, a difference of 0.22%), and Central American Indian (5.6%, a difference of 0.23%).
| Demographics | Rating | Rank | Unemployment Among Ages 35 to 44 years |
| Cree | 0.0 /100 | #288 | Tragic 5.5% |
| Spanish American Indians | 0.0 /100 | #289 | Tragic 5.5% |
| Jamaicans | 0.0 /100 | #290 | Tragic 5.5% |
| Dutch West Indians | 0.0 /100 | #291 | Tragic 5.5% |
| Immigrants | Haiti | 0.0 /100 | #292 | Tragic 5.5% |
| Central American Indians | 0.0 /100 | #293 | Tragic 5.6% |
| Trinidadians and Tobagonians | 0.0 /100 | #294 | Tragic 5.6% |
| Ottawa | 0.0 /100 | #295 | Tragic 5.6% |
| Immigrants | Trinidad and Tobago | 0.0 /100 | #296 | Tragic 5.6% |
| U.S. Virgin Islanders | 0.0 /100 | #297 | Tragic 5.6% |
| Aleuts | 0.0 /100 | #298 | Tragic 5.6% |
| Immigrants | Jamaica | 0.0 /100 | #299 | Tragic 5.6% |
| Immigrants | West Indies | 0.0 /100 | #300 | Tragic 5.6% |
| Africans | 0.0 /100 | #301 | Tragic 5.6% |
| Nepalese | 0.0 /100 | #302 | Tragic 5.6% |