Immigrants from Saudi Arabia vs Ottawa Unemployment Among Ages 35 to 44 years
COMPARE
Immigrants from Saudi Arabia
Ottawa
Unemployment Among Ages 35 to 44 years
Unemployment Among Ages 35 to 44 years Comparison
Immigrants from Saudi Arabia
Ottawa
4.5%
UNEMPLOYMENT AMONG AGES 35 TO 44 YEARS
91.3/ 100
METRIC RATING
105th/ 347
METRIC RANK
5.6%
UNEMPLOYMENT AMONG AGES 35 TO 44 YEARS
0.0/ 100
METRIC RATING
295th/ 347
METRIC RANK
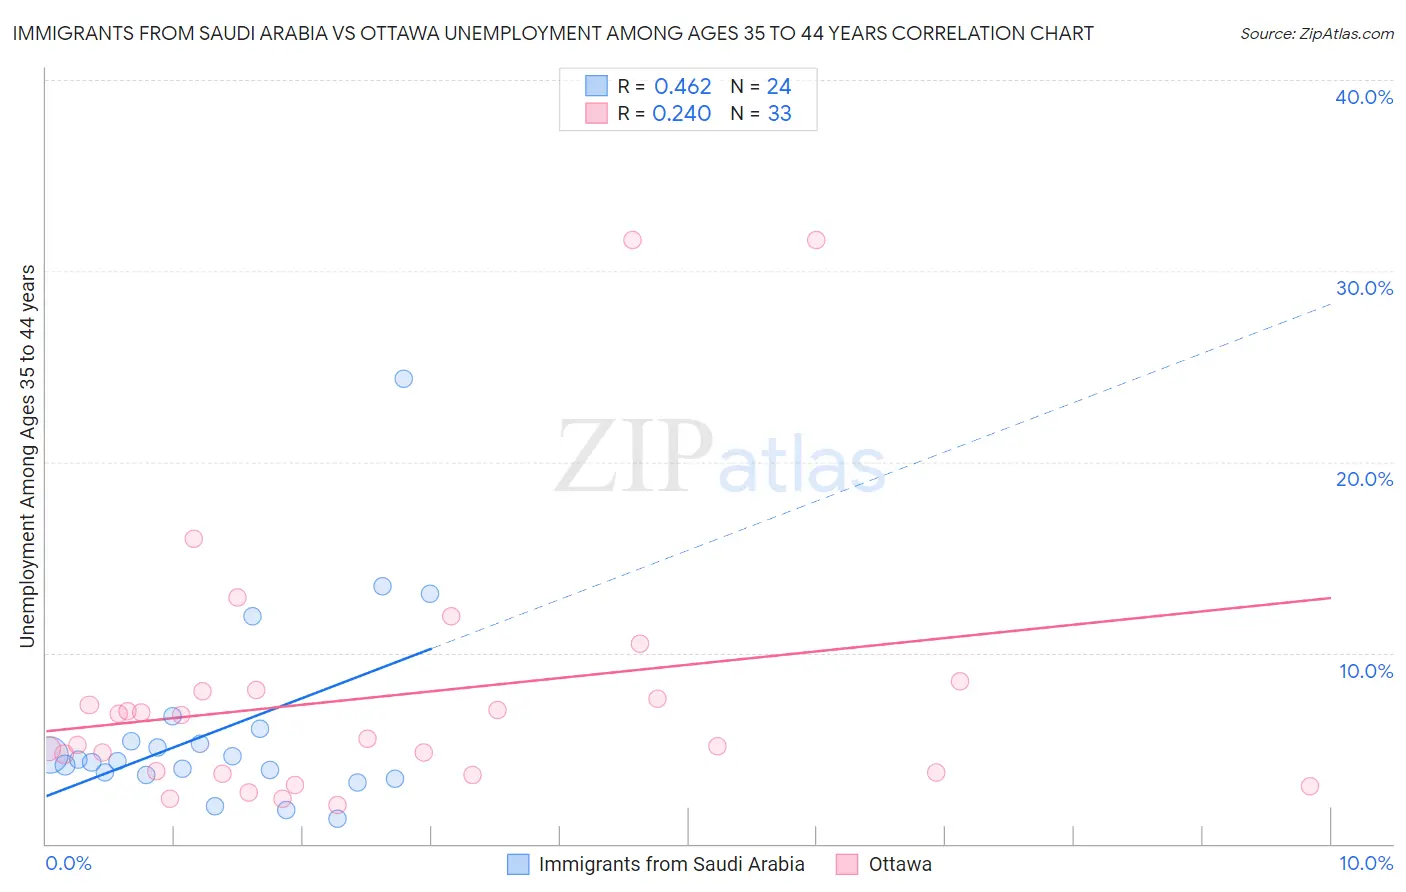
Immigrants from Saudi Arabia vs Ottawa Unemployment Among Ages 35 to 44 years Correlation Chart
The statistical analysis conducted on geographies consisting of 163,387,479 people shows a moderate positive correlation between the proportion of Immigrants from Saudi Arabia and unemployment rate among population between the ages 35 and 44 in the United States with a correlation coefficient (R) of 0.462 and weighted average of 4.5%. Similarly, the statistical analysis conducted on geographies consisting of 49,559,815 people shows a weak positive correlation between the proportion of Ottawa and unemployment rate among population between the ages 35 and 44 in the United States with a correlation coefficient (R) of 0.240 and weighted average of 5.6%, a difference of 24.0%.
Unemployment Among Ages 35 to 44 years Correlation Summary
| Measurement | Immigrants from Saudi Arabia | Ottawa |
| Minimum | 1.3% | 2.0% |
| Maximum | 24.4% | 31.6% |
| Range | 23.1% | 29.6% |
| Mean | 6.0% | 7.7% |
| Median | 4.4% | 5.5% |
| Interquartile 25% (IQ1) | 3.7% | 3.7% |
| Interquartile 75% (IQ3) | 5.7% | 8.0% |
| Interquartile Range (IQR) | 2.0% | 4.3% |
| Standard Deviation (Sample) | 5.1% | 6.9% |
| Standard Deviation (Population) | 4.9% | 6.8% |
Similar Demographics by Unemployment Among Ages 35 to 44 years
Demographics Similar to Immigrants from Saudi Arabia by Unemployment Among Ages 35 to 44 years
In terms of unemployment among ages 35 to 44 years, the demographic groups most similar to Immigrants from Saudi Arabia are Immigrants from North America (4.5%, a difference of 0.030%), Finnish (4.5%, a difference of 0.060%), Welsh (4.5%, a difference of 0.080%), Immigrants from Sudan (4.5%, a difference of 0.11%), and Immigrants from North Macedonia (4.5%, a difference of 0.13%).
| Demographics | Rating | Rank | Unemployment Among Ages 35 to 44 years |
| Immigrants | Canada | 92.3 /100 | #98 | Exceptional 4.5% |
| Immigrants | Egypt | 92.3 /100 | #99 | Exceptional 4.5% |
| Italians | 91.9 /100 | #100 | Exceptional 4.5% |
| Immigrants | Netherlands | 91.9 /100 | #101 | Exceptional 4.5% |
| Immigrants | Sudan | 91.8 /100 | #102 | Exceptional 4.5% |
| Welsh | 91.6 /100 | #103 | Exceptional 4.5% |
| Finns | 91.6 /100 | #104 | Exceptional 4.5% |
| Immigrants | Saudi Arabia | 91.3 /100 | #105 | Exceptional 4.5% |
| Immigrants | North America | 91.1 /100 | #106 | Exceptional 4.5% |
| Immigrants | North Macedonia | 90.7 /100 | #107 | Exceptional 4.5% |
| New Zealanders | 90.3 /100 | #108 | Exceptional 4.5% |
| Romanians | 90.3 /100 | #109 | Exceptional 4.5% |
| Immigrants | Kazakhstan | 90.0 /100 | #110 | Excellent 4.5% |
| Immigrants | Nicaragua | 89.8 /100 | #111 | Excellent 4.5% |
| Immigrants | Czechoslovakia | 89.2 /100 | #112 | Excellent 4.5% |
Demographics Similar to Ottawa by Unemployment Among Ages 35 to 44 years
In terms of unemployment among ages 35 to 44 years, the demographic groups most similar to Ottawa are Immigrants from Trinidad and Tobago (5.6%, a difference of 0.020%), U.S. Virgin Islander (5.6%, a difference of 0.12%), Aleut (5.6%, a difference of 0.13%), Trinidadian and Tobagonian (5.6%, a difference of 0.22%), and Central American Indian (5.6%, a difference of 0.23%).
| Demographics | Rating | Rank | Unemployment Among Ages 35 to 44 years |
| Cree | 0.0 /100 | #288 | Tragic 5.5% |
| Spanish American Indians | 0.0 /100 | #289 | Tragic 5.5% |
| Jamaicans | 0.0 /100 | #290 | Tragic 5.5% |
| Dutch West Indians | 0.0 /100 | #291 | Tragic 5.5% |
| Immigrants | Haiti | 0.0 /100 | #292 | Tragic 5.5% |
| Central American Indians | 0.0 /100 | #293 | Tragic 5.6% |
| Trinidadians and Tobagonians | 0.0 /100 | #294 | Tragic 5.6% |
| Ottawa | 0.0 /100 | #295 | Tragic 5.6% |
| Immigrants | Trinidad and Tobago | 0.0 /100 | #296 | Tragic 5.6% |
| U.S. Virgin Islanders | 0.0 /100 | #297 | Tragic 5.6% |
| Aleuts | 0.0 /100 | #298 | Tragic 5.6% |
| Immigrants | Jamaica | 0.0 /100 | #299 | Tragic 5.6% |
| Immigrants | West Indies | 0.0 /100 | #300 | Tragic 5.6% |
| Africans | 0.0 /100 | #301 | Tragic 5.6% |
| Nepalese | 0.0 /100 | #302 | Tragic 5.6% |