Immigrants from Turkey vs Immigrants from Italy Unemployment Among Seniors over 65 years
COMPARE
Immigrants from Turkey
Immigrants from Italy
Unemployment Among Seniors over 65 years
Unemployment Among Seniors over 65 years Comparison
Immigrants from Turkey
Immigrants from Italy
5.0%
UNEMPLOYMENT AMONG SENIORS OVER 65 YEARS
94.3/ 100
METRIC RATING
106th/ 347
METRIC RANK
5.2%
UNEMPLOYMENT AMONG SENIORS OVER 65 YEARS
43.5/ 100
METRIC RATING
181st/ 347
METRIC RANK
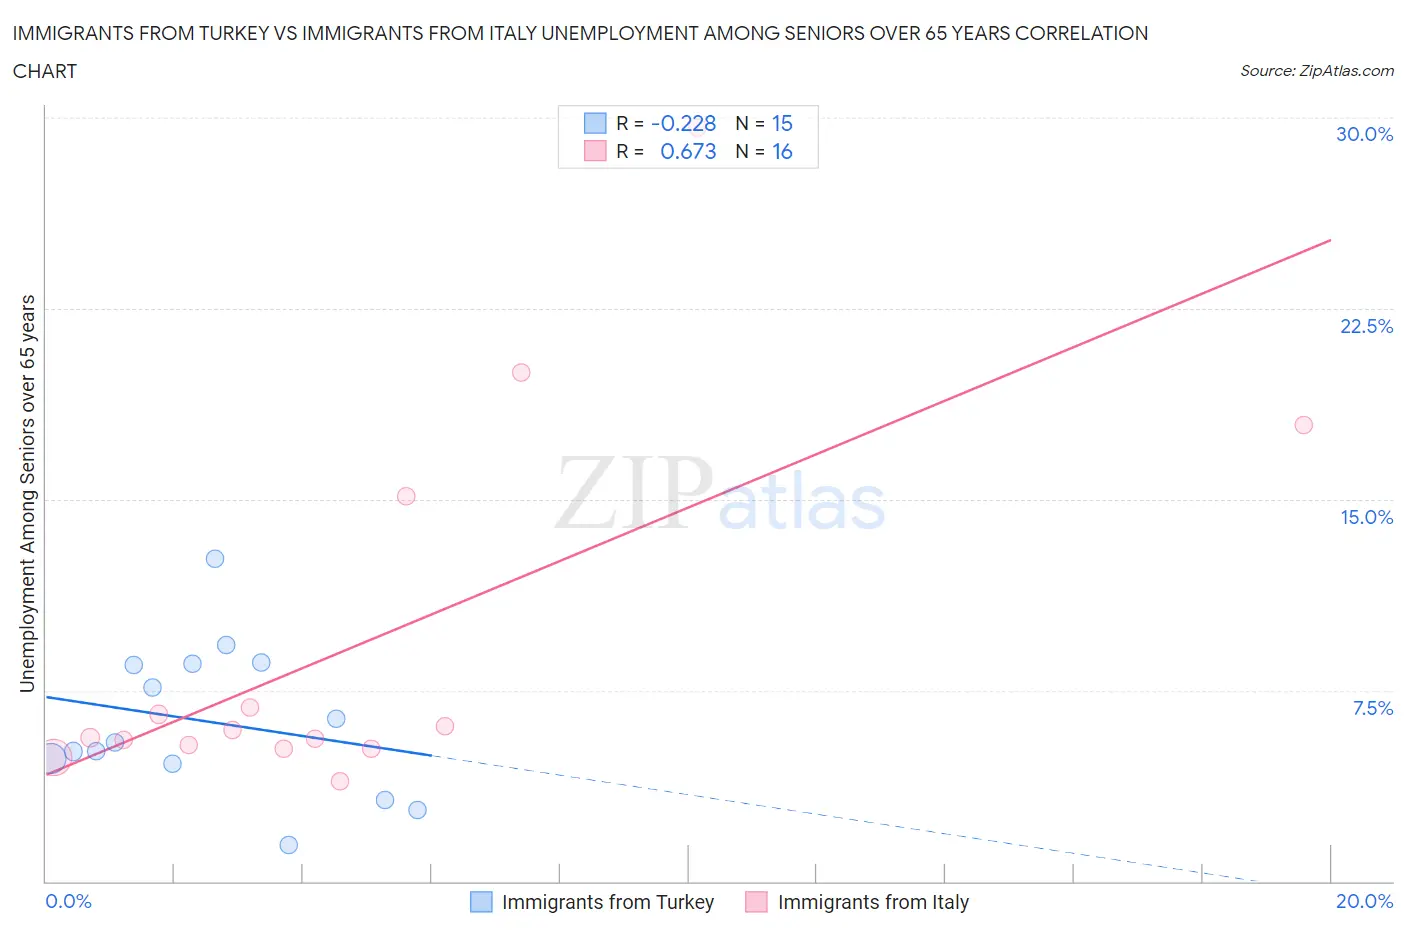
Immigrants from Turkey vs Immigrants from Italy Unemployment Among Seniors over 65 years Correlation Chart
The statistical analysis conducted on geographies consisting of 212,028,802 people shows a weak negative correlation between the proportion of Immigrants from Turkey and unemployment rate amomg seniors over the age of 65 in the United States with a correlation coefficient (R) of -0.228 and weighted average of 5.0%. Similarly, the statistical analysis conducted on geographies consisting of 301,600,513 people shows a significant positive correlation between the proportion of Immigrants from Italy and unemployment rate amomg seniors over the age of 65 in the United States with a correlation coefficient (R) of 0.673 and weighted average of 5.2%, a difference of 2.5%.
Unemployment Among Seniors over 65 years Correlation Summary
| Measurement | Immigrants from Turkey | Immigrants from Italy |
| Minimum | 1.4% | 3.9% |
| Maximum | 12.7% | 29.6% |
| Range | 11.3% | 25.7% |
| Mean | 6.3% | 9.3% |
| Median | 5.5% | 5.8% |
| Interquartile 25% (IQ1) | 4.6% | 5.3% |
| Interquartile 75% (IQ3) | 8.5% | 11.0% |
| Interquartile Range (IQR) | 3.9% | 5.7% |
| Standard Deviation (Sample) | 2.9% | 7.3% |
| Standard Deviation (Population) | 2.8% | 7.1% |
Similar Demographics by Unemployment Among Seniors over 65 years
Demographics Similar to Immigrants from Turkey by Unemployment Among Seniors over 65 years
In terms of unemployment among seniors over 65 years, the demographic groups most similar to Immigrants from Turkey are Okinawan (5.0%, a difference of 0.060%), Immigrants from Scotland (5.0%, a difference of 0.11%), Immigrants from Lithuania (5.0%, a difference of 0.13%), Immigrants from Germany (5.0%, a difference of 0.16%), and Immigrants from Thailand (5.0%, a difference of 0.18%).
| Demographics | Rating | Rank | Unemployment Among Seniors over 65 years |
| South Africans | 96.5 /100 | #99 | Exceptional 5.0% |
| Romanians | 95.5 /100 | #100 | Exceptional 5.0% |
| Yugoslavians | 95.4 /100 | #101 | Exceptional 5.0% |
| Immigrants | Thailand | 95.4 /100 | #102 | Exceptional 5.0% |
| Immigrants | Lithuania | 95.1 /100 | #103 | Exceptional 5.0% |
| Immigrants | Scotland | 95.0 /100 | #104 | Exceptional 5.0% |
| Okinawans | 94.7 /100 | #105 | Exceptional 5.0% |
| Immigrants | Turkey | 94.3 /100 | #106 | Exceptional 5.0% |
| Immigrants | Germany | 93.2 /100 | #107 | Exceptional 5.0% |
| Immigrants | Vietnam | 92.9 /100 | #108 | Exceptional 5.0% |
| Immigrants | Malaysia | 92.7 /100 | #109 | Exceptional 5.0% |
| Immigrants | Saudi Arabia | 92.7 /100 | #110 | Exceptional 5.0% |
| Finns | 92.2 /100 | #111 | Exceptional 5.0% |
| Eastern Europeans | 92.0 /100 | #112 | Exceptional 5.0% |
| Seminole | 91.4 /100 | #113 | Exceptional 5.0% |
Demographics Similar to Immigrants from Italy by Unemployment Among Seniors over 65 years
In terms of unemployment among seniors over 65 years, the demographic groups most similar to Immigrants from Italy are Russian (5.2%, a difference of 0.0%), Panamanian (5.2%, a difference of 0.010%), Immigrants from Somalia (5.2%, a difference of 0.020%), Immigrants from Belgium (5.2%, a difference of 0.040%), and Immigrants from Western Asia (5.2%, a difference of 0.040%).
| Demographics | Rating | Rank | Unemployment Among Seniors over 65 years |
| Spanish Americans | 50.0 /100 | #174 | Average 5.1% |
| Immigrants | Eastern Europe | 49.8 /100 | #175 | Average 5.1% |
| Indians (Asian) | 46.6 /100 | #176 | Average 5.2% |
| Icelanders | 45.9 /100 | #177 | Average 5.2% |
| Immigrants | Belgium | 44.8 /100 | #178 | Average 5.2% |
| Immigrants | Somalia | 44.0 /100 | #179 | Average 5.2% |
| Russians | 43.6 /100 | #180 | Average 5.2% |
| Immigrants | Italy | 43.5 /100 | #181 | Average 5.2% |
| Panamanians | 43.0 /100 | #182 | Average 5.2% |
| Immigrants | Western Asia | 42.1 /100 | #183 | Average 5.2% |
| Immigrants | Serbia | 41.6 /100 | #184 | Average 5.2% |
| Immigrants | Iran | 36.0 /100 | #185 | Fair 5.2% |
| Americans | 35.1 /100 | #186 | Fair 5.2% |
| Somalis | 33.5 /100 | #187 | Fair 5.2% |
| Immigrants | Egypt | 33.2 /100 | #188 | Fair 5.2% |