Immigrants from Trinidad and Tobago vs Immigrants from Liberia Unemployment Among Ages 20 to 24 years
COMPARE
Immigrants from Trinidad and Tobago
Immigrants from Liberia
Unemployment Among Ages 20 to 24 years
Unemployment Among Ages 20 to 24 years Comparison
Immigrants from Trinidad and Tobago
Immigrants from Liberia
12.8%
UNEMPLOYMENT AMONG AGES 20 TO 24 YEARS
0.0/ 100
METRIC RATING
317th/ 347
METRIC RANK
11.1%
UNEMPLOYMENT AMONG AGES 20 TO 24 YEARS
0.0/ 100
METRIC RATING
266th/ 347
METRIC RANK
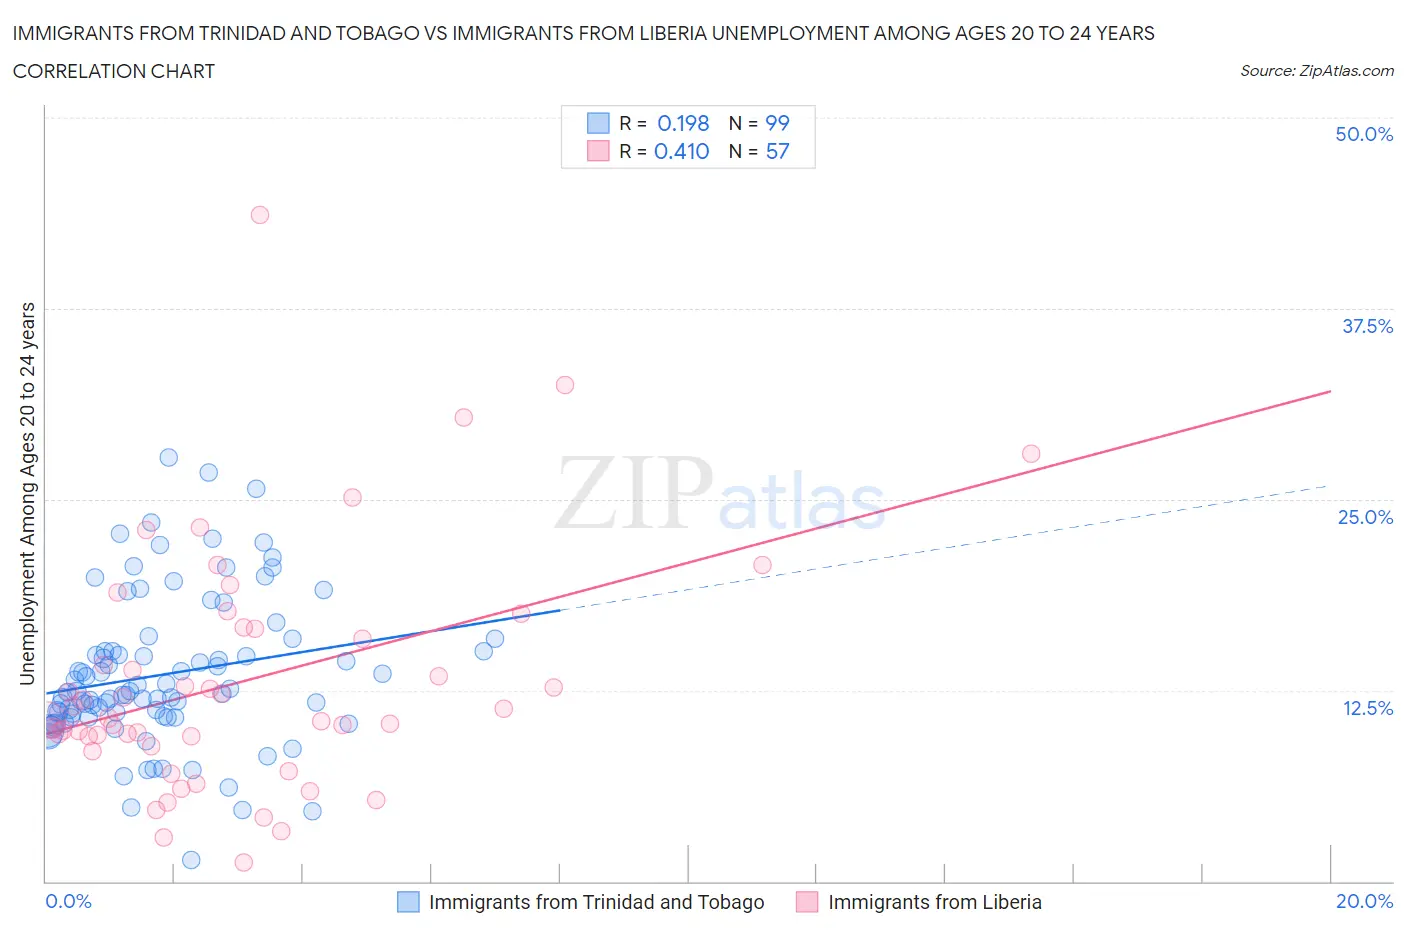
Immigrants from Trinidad and Tobago vs Immigrants from Liberia Unemployment Among Ages 20 to 24 years Correlation Chart
The statistical analysis conducted on geographies consisting of 220,132,241 people shows a poor positive correlation between the proportion of Immigrants from Trinidad and Tobago and unemployment rate among population between the ages 20 and 24 in the United States with a correlation coefficient (R) of 0.198 and weighted average of 12.8%. Similarly, the statistical analysis conducted on geographies consisting of 134,103,977 people shows a moderate positive correlation between the proportion of Immigrants from Liberia and unemployment rate among population between the ages 20 and 24 in the United States with a correlation coefficient (R) of 0.410 and weighted average of 11.1%, a difference of 15.7%.
Unemployment Among Ages 20 to 24 years Correlation Summary
| Measurement | Immigrants from Trinidad and Tobago | Immigrants from Liberia |
| Minimum | 1.4% | 1.2% |
| Maximum | 27.7% | 43.6% |
| Range | 26.3% | 42.4% |
| Mean | 13.6% | 13.1% |
| Median | 12.4% | 10.7% |
| Interquartile 25% (IQ1) | 10.7% | 9.2% |
| Interquartile 75% (IQ3) | 15.1% | 16.6% |
| Interquartile Range (IQR) | 4.3% | 7.4% |
| Standard Deviation (Sample) | 4.9% | 7.9% |
| Standard Deviation (Population) | 4.9% | 7.8% |
Similar Demographics by Unemployment Among Ages 20 to 24 years
Demographics Similar to Immigrants from Trinidad and Tobago by Unemployment Among Ages 20 to 24 years
In terms of unemployment among ages 20 to 24 years, the demographic groups most similar to Immigrants from Trinidad and Tobago are Immigrants from Dominica (12.8%, a difference of 0.12%), Barbadian (12.9%, a difference of 0.25%), Trinidadian and Tobagonian (12.9%, a difference of 0.51%), West Indian (12.8%, a difference of 0.60%), and Black/African American (12.7%, a difference of 0.80%).
| Demographics | Rating | Rank | Unemployment Among Ages 20 to 24 years |
| Jamaicans | 0.0 /100 | #310 | Tragic 12.6% |
| Vietnamese | 0.0 /100 | #311 | Tragic 12.6% |
| Houma | 0.0 /100 | #312 | Tragic 12.6% |
| Shoshone | 0.0 /100 | #313 | Tragic 12.7% |
| Blacks/African Americans | 0.0 /100 | #314 | Tragic 12.7% |
| West Indians | 0.0 /100 | #315 | Tragic 12.8% |
| Immigrants | Dominica | 0.0 /100 | #316 | Tragic 12.8% |
| Immigrants | Trinidad and Tobago | 0.0 /100 | #317 | Tragic 12.8% |
| Barbadians | 0.0 /100 | #318 | Tragic 12.9% |
| Trinidadians and Tobagonians | 0.0 /100 | #319 | Tragic 12.9% |
| Cheyenne | 0.0 /100 | #320 | Tragic 13.0% |
| Immigrants | Jamaica | 0.0 /100 | #321 | Tragic 13.0% |
| Natives/Alaskans | 0.0 /100 | #322 | Tragic 13.0% |
| Yakama | 0.0 /100 | #323 | Tragic 13.1% |
| Alaska Natives | 0.0 /100 | #324 | Tragic 13.2% |
Demographics Similar to Immigrants from Liberia by Unemployment Among Ages 20 to 24 years
In terms of unemployment among ages 20 to 24 years, the demographic groups most similar to Immigrants from Liberia are Immigrants from Ireland (11.1%, a difference of 0.090%), Subsaharan African (11.1%, a difference of 0.16%), Immigrants from Greece (11.1%, a difference of 0.28%), Maltese (11.2%, a difference of 0.72%), and Marshallese (11.0%, a difference of 0.91%).
| Demographics | Rating | Rank | Unemployment Among Ages 20 to 24 years |
| Panamanians | 0.2 /100 | #259 | Tragic 10.9% |
| Immigrants | Lebanon | 0.2 /100 | #260 | Tragic 10.9% |
| Puget Sound Salish | 0.2 /100 | #261 | Tragic 10.9% |
| Immigrants | Latin America | 0.1 /100 | #262 | Tragic 11.0% |
| Marshallese | 0.1 /100 | #263 | Tragic 11.0% |
| Sub-Saharan Africans | 0.0 /100 | #264 | Tragic 11.1% |
| Immigrants | Ireland | 0.0 /100 | #265 | Tragic 11.1% |
| Immigrants | Liberia | 0.0 /100 | #266 | Tragic 11.1% |
| Immigrants | Greece | 0.0 /100 | #267 | Tragic 11.1% |
| Maltese | 0.0 /100 | #268 | Tragic 11.2% |
| Ute | 0.0 /100 | #269 | Tragic 11.2% |
| Delaware | 0.0 /100 | #270 | Tragic 11.3% |
| Immigrants | Uzbekistan | 0.0 /100 | #271 | Tragic 11.4% |
| Nigerians | 0.0 /100 | #272 | Tragic 11.4% |
| Immigrants | Nigeria | 0.0 /100 | #273 | Tragic 11.5% |