Danish vs Immigrants from Liberia Unemployment Among Ages 20 to 24 years

COMPARE

Danish
Race
Ancestry
AfghanAfricanAlaska NativeAlaskan AthabascanAlbanianAleutAlsatianAmericanApacheArabArapahoArgentineanArmenianAssyrian/Chaldean/SyriacAustralianAustrianBahamianBangladeshiBarbadianBasqueBelgianBelizeanBermudanBhutaneseBlackfeetBolivianBrazilianBritishBritish West IndianBulgarianBurmeseCajunCambodianCanadianCape VerdeanCarpatho RusynCelticCentral AmericanCentral American IndianCherokeeCheyenneChickasawChileanChineseChippewaChoctawColombianColvilleComancheCosta RicanCreeCreekCroatianCrowCubanCypriotCzechCzechoslovakianDanishDelawareDominicanDutchDutch West IndianEastern EuropeanEcuadorianEgyptianEnglishEstonianEthiopianEuropeanFijianFilipinoFinnishFrenchFrench American IndianFrench CanadianGermanGerman RussianGhanaianGreekGuamanian/ChamorroGuatemalanGuyaneseHaitianHmongHonduranHopiHoumaHungarianIcelanderIndian (Asian)IndonesianInupiatIranianIraqiIrishIroquoisIsraeliItalianJamaicanJapaneseJordanianKenyanKiowaKoreanLaotianLatvianLebaneseLiberianLithuanianLumbeeLuxembourgerMacedonianMalaysianMalteseMarshalleseMenomineeMexicanMexican American IndianMongolianMoroccanNative HawaiianNavajoNepaleseNew ZealanderNicaraguanNigerianNorthern EuropeanNorwegianOkinawanOsageOttawaPaiutePakistaniPalestinianPanamanianParaguayanPennsylvania GermanPeruvianPimaPolishPortuguesePotawatomiPuebloPuerto RicanPuget Sound SalishRomanianRussianSalvadoranSamoanScandinavianScotch-IrishScottishSeminoleSenegaleseSerbianShoshoneSierra LeoneanSiouxSlavicSlovakSloveneSomaliSouth AfricanSouth AmericanSouth American IndianSoviet UnionSpaniardSpanishSpanish AmericanSpanish American IndianSri LankanSubsaharan AfricanSudaneseSwedishSwissSyrianTaiwaneseThaiTlingit-HaidaTohono O'OdhamTonganTrinidadian and TobagonianTsimshianTurkishU.S. Virgin IslanderUgandanUkrainianUruguayanUteVenezuelanVietnameseWelshWest IndianYakamaYaquiYugoslavianYumanYup'ikZimbabwean
Immigration
NonimmigrantsImmigrantsAfghanistanAfricaAlbaniaArgentinaArmeniaAsiaAustraliaAustriaBahamasBangladeshBarbadosBelarusBelgiumBelizeBoliviaBosnia and HerzegovinaBrazilBulgariaBurma/MyanmarCabo VerdeCambodiaCameroonCanadaCaribbeanCentral AmericaChileChinaColombiaCongoCosta RicaCroatiaCubaCzechoslovakiaDenmarkDominicaDominican RepublicEastern AfricaEastern AsiaEastern EuropeEcuadorEgyptEl SalvadorEnglandEritreaEthiopiaEuropeFijiFranceGermanyGhanaGreeceGrenadaGuatemalaGuyanaHaitiHondurasHong KongHungaryIndiaIndonesiaIranIraqIrelandIsraelItalyJamaicaJapanJordanKazakhstanKenyaKoreaKuwaitLaosLatin AmericaLatviaLebanonLithuaniaMalaysiaMexicoMicronesiaMiddle AfricaMoldovaMoroccoNepalNetherlandsNicaraguaNigeriaNorth AmericaNorth MacedoniaNorthern AfricaNorthern EuropeNorwayOceaniaPakistanPanamaPeruPhilippinesPolandPortugalRomaniaRussiaSaudi ArabiaScotlandSenegalSerbiaSierra LeoneSingaporeSomaliaSouth AfricaSouth AmericaSouth Central AsiaSouth Eastern AsiaSouthern EuropeSpainSri LankaSt. Vincent and the GrenadinesSudanSwedenSwitzerlandSyriaTaiwanThailandTrinidad and TobagoTurkeyUgandaUkraineUruguayUzbekistanVenezuelaVietnamWest IndiesWestern AfricaWestern AsiaWestern EuropeYemenZaireZimbabweAzores
Immigrants from Liberia
Race
Ancestry
AfghanAfricanAlaska NativeAlaskan AthabascanAlbanianAleutAlsatianAmericanApacheArabArapahoArgentineanArmenianAssyrian/Chaldean/SyriacAustralianAustrianBahamianBangladeshiBarbadianBasqueBelgianBelizeanBermudanBhutaneseBlackfeetBolivianBrazilianBritishBritish West IndianBulgarianBurmeseCajunCambodianCanadianCape VerdeanCarpatho RusynCelticCentral AmericanCentral American IndianCherokeeCheyenneChickasawChileanChineseChippewaChoctawColombianColvilleComancheCosta RicanCreeCreekCroatianCrowCubanCypriotCzechCzechoslovakianDelawareDominicanDutchDutch West IndianEastern EuropeanEcuadorianEgyptianEnglishEstonianEthiopianEuropeanFijianFilipinoFinnishFrenchFrench American IndianFrench CanadianGermanGerman RussianGhanaianGreekGuamanian/ChamorroGuatemalanGuyaneseHaitianHmongHonduranHopiHoumaHungarianIcelanderIndian (Asian)IndonesianInupiatIranianIraqiIrishIroquoisIsraeliItalianJamaicanJapaneseJordanianKenyanKiowaKoreanLaotianLatvianLebaneseLiberianLithuanianLumbeeLuxembourgerMacedonianMalaysianMalteseMarshalleseMenomineeMexicanMexican American IndianMongolianMoroccanNative HawaiianNavajoNepaleseNew ZealanderNicaraguanNigerianNorthern EuropeanNorwegianOkinawanOsageOttawaPaiutePakistaniPalestinianPanamanianParaguayanPennsylvania GermanPeruvianPimaPolishPortuguesePotawatomiPuebloPuerto RicanPuget Sound SalishRomanianRussianSalvadoranSamoanScandinavianScotch-IrishScottishSeminoleSenegaleseSerbianShoshoneSierra LeoneanSiouxSlavicSlovakSloveneSomaliSouth AfricanSouth AmericanSouth American IndianSoviet UnionSpaniardSpanishSpanish AmericanSpanish American IndianSri LankanSubsaharan AfricanSudaneseSwedishSwissSyrianTaiwaneseThaiTlingit-HaidaTohono O'OdhamTonganTrinidadian and TobagonianTsimshianTurkishU.S. Virgin IslanderUgandanUkrainianUruguayanUteVenezuelanVietnameseWelshWest IndianYakamaYaquiYugoslavianYumanYup'ikZimbabwean
Immigration
NonimmigrantsImmigrantsAfghanistanAfricaAlbaniaArgentinaArmeniaAsiaAustraliaAustriaBahamasBangladeshBarbadosBelarusBelgiumBelizeBoliviaBosnia and HerzegovinaBrazilBulgariaBurma/MyanmarCabo VerdeCambodiaCameroonCanadaCaribbeanCentral AmericaChileChinaColombiaCongoCosta RicaCroatiaCubaCzechoslovakiaDenmarkDominicaDominican RepublicEastern AfricaEastern AsiaEastern EuropeEcuadorEgyptEl SalvadorEnglandEritreaEthiopiaEuropeFijiFranceGermanyGhanaGreeceGrenadaGuatemalaGuyanaHaitiHondurasHong KongHungaryIndiaIndonesiaIranIraqIrelandIsraelItalyJamaicaJapanJordanKazakhstanKenyaKoreaKuwaitLaosLatin AmericaLatviaLebanonLiberiaLithuaniaMalaysiaMexicoMicronesiaMiddle AfricaMoldovaMoroccoNepalNetherlandsNicaraguaNigeriaNorth AmericaNorth MacedoniaNorthern AfricaNorthern EuropeNorwayOceaniaPakistanPanamaPeruPhilippinesPolandPortugalRomaniaRussiaSaudi ArabiaScotlandSenegalSerbiaSierra LeoneSingaporeSomaliaSouth AfricaSouth AmericaSouth Central AsiaSouth Eastern AsiaSouthern EuropeSpainSri LankaSt. Vincent and the GrenadinesSudanSwedenSwitzerlandSyriaTaiwanThailandTrinidad and TobagoTurkeyUgandaUkraineUruguayUzbekistanVenezuelaVietnamWest IndiesWestern AfricaWestern AsiaWestern EuropeYemenZaireZimbabweAzores
Unemployment Among Ages 20 to 24 years
Income
Poverty
Unemployment
Labor Participation
Family Structure
Vehicle Availability
Education Level
Disability

Unemployment Among Ages 20 to 24 years Comparison

Danes

Immigrants from Liberia

Exceptional
Tragic
9.3%
UNEMPLOYMENT AMONG AGES 20 TO 24 YEARS
100.0/ 100
METRIC RATING
16th/ 347
METRIC RANK
11.1%
UNEMPLOYMENT AMONG AGES 20 TO 24 YEARS
0.0/ 100
METRIC RATING
266th/ 347
METRIC RANK

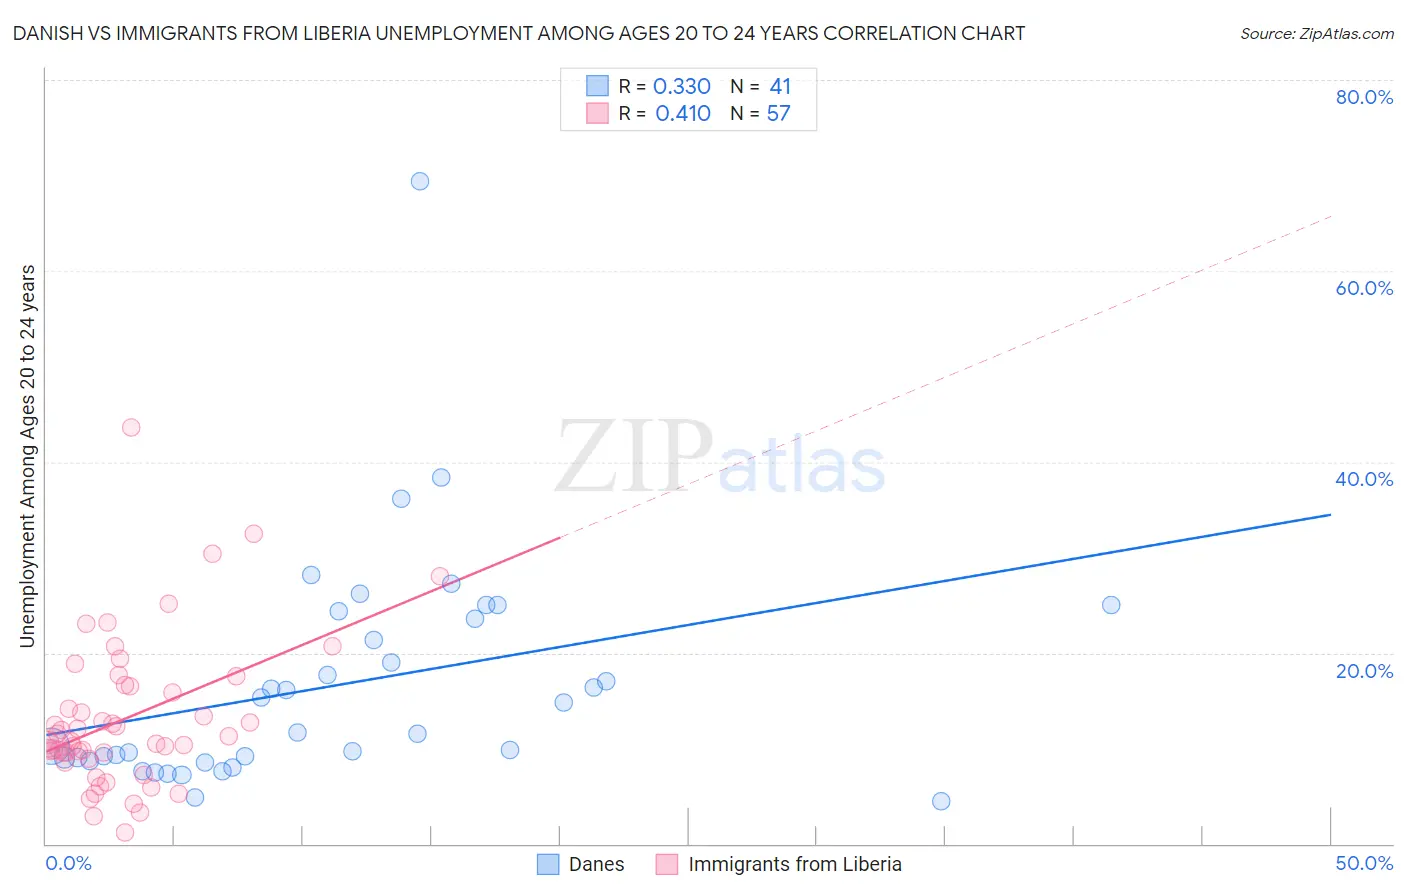
Danish vs Immigrants from Liberia Unemployment Among Ages 20 to 24 years Correlation Chart

The statistical analysis conducted on geographies consisting of 447,112,661 people shows a mild positive correlation between the proportion of Danes and unemployment rate among population between the ages 20 and 24 in the United States with a correlation coefficient (R) of 0.330 and weighted average of 9.3%. Similarly, the statistical analysis conducted on geographies consisting of 134,103,977 people shows a moderate positive correlation between the proportion of Immigrants from Liberia and unemployment rate among population between the ages 20 and 24 in the United States with a correlation coefficient (R) of 0.410 and weighted average of 11.1%, a difference of 19.5%.
Danish vs Immigrants from Liberia Unemployment Among Ages 20 to 24 years

Unemployment Among Ages 20 to 24 years Correlation Summary

MeasurementDanishImmigrants from Liberia
Minimum4.5%1.2%
Maximum69.4%43.6%
Range64.9%42.4%
Mean16.6%13.1%
Median11.6%10.7%
Interquartile 25% (IQ1)8.9%9.2%
Interquartile 75% (IQ3)23.9%16.6%
Interquartile Range (IQR)15.1%7.4%
Standard Deviation (Sample)12.0%7.9%
Standard Deviation (Population)11.8%7.8%

Similar Demographics by Unemployment Among Ages 20 to 24 years

Demographics Similar to Danes by Unemployment Among Ages 20 to 24 years

In terms of unemployment among ages 20 to 24 years, the demographic groups most similar to Danes are Immigrants from Sudan (9.3%, a difference of 0.16%), Slovene (9.3%, a difference of 0.19%), Czech (9.3%, a difference of 0.51%), Immigrants from Congo (9.2%, a difference of 0.57%), and Cuban (9.2%, a difference of 0.65%).
DemographicsRating | RankUnemployment Among Ages 20 to 24 years
Immigrants | Somalia
100.0
/100
|
#9
Exceptional
9.2%
Sudanese
100.0
/100
|
#10
Exceptional
9.2%
Zimbabweans
100.0
/100
|
#11
Exceptional
9.2%
Cubans
100.0
/100
|
#12
Exceptional
9.2%
Immigrants | Congo
100.0
/100
|
#13
Exceptional
9.2%
Slovenes
100.0
/100
|
#14
Exceptional
9.3%
Immigrants | Sudan
100.0
/100
|
#15
Exceptional
9.3%
Danes
100.0
/100
|
#16
Exceptional
9.3%
Czechs
100.0
/100
|
#17
Exceptional
9.3%
Chinese
100.0
/100
|
#18
Exceptional
9.4%
Hmong
100.0
/100
|
#19
Exceptional
9.4%
Osage
100.0
/100
|
#20
Exceptional
9.4%
Immigrants | Bosnia and Herzegovina
100.0
/100
|
#21
Exceptional
9.4%
Tongans
100.0
/100
|
#22
Exceptional
9.4%
Immigrants | Nepal
100.0
/100
|
#23
Exceptional
9.4%

Demographics Similar to Immigrants from Liberia by Unemployment Among Ages 20 to 24 years

In terms of unemployment among ages 20 to 24 years, the demographic groups most similar to Immigrants from Liberia are Immigrants from Ireland (11.1%, a difference of 0.090%), Subsaharan African (11.1%, a difference of 0.16%), Immigrants from Greece (11.1%, a difference of 0.28%), Maltese (11.2%, a difference of 0.72%), and Marshallese (11.0%, a difference of 0.91%).
DemographicsRating | RankUnemployment Among Ages 20 to 24 years
Panamanians
0.2
/100
|
#259
Tragic
10.9%
Immigrants | Lebanon
0.2
/100
|
#260
Tragic
10.9%
Puget Sound Salish
0.2
/100
|
#261
Tragic
10.9%
Immigrants | Latin America
0.1
/100
|
#262
Tragic
11.0%
Marshallese
0.1
/100
|
#263
Tragic
11.0%
Sub-Saharan Africans
0.0
/100
|
#264
Tragic
11.1%
Immigrants | Ireland
0.0
/100
|
#265
Tragic
11.1%
Immigrants | Liberia
0.0
/100
|
#266
Tragic
11.1%
Immigrants | Greece
0.0
/100
|
#267
Tragic
11.1%
Maltese
0.0
/100
|
#268
Tragic
11.2%
Ute
0.0
/100
|
#269
Tragic
11.2%
Delaware
0.0
/100
|
#270
Tragic
11.3%
Immigrants | Uzbekistan
0.0
/100
|
#271
Tragic
11.4%
Nigerians
0.0
/100
|
#272
Tragic
11.4%
Immigrants | Nigeria
0.0
/100
|
#273
Tragic
11.5%