Immigrants from Thailand vs Israeli Unemployment Among Women with Children Under 18 years
COMPARE
Immigrants from Thailand
Israeli
Unemployment Among Women with Children Under 18 years
Unemployment Among Women with Children Under 18 years Comparison
Immigrants from Thailand
Israelis
5.4%
UNEMPLOYMENT AMONG WOMEN WITH CHILDREN UNDER 18 YEARS
55.3/ 100
METRIC RATING
169th/ 347
METRIC RANK
5.6%
UNEMPLOYMENT AMONG WOMEN WITH CHILDREN UNDER 18 YEARS
15.6/ 100
METRIC RATING
204th/ 347
METRIC RANK
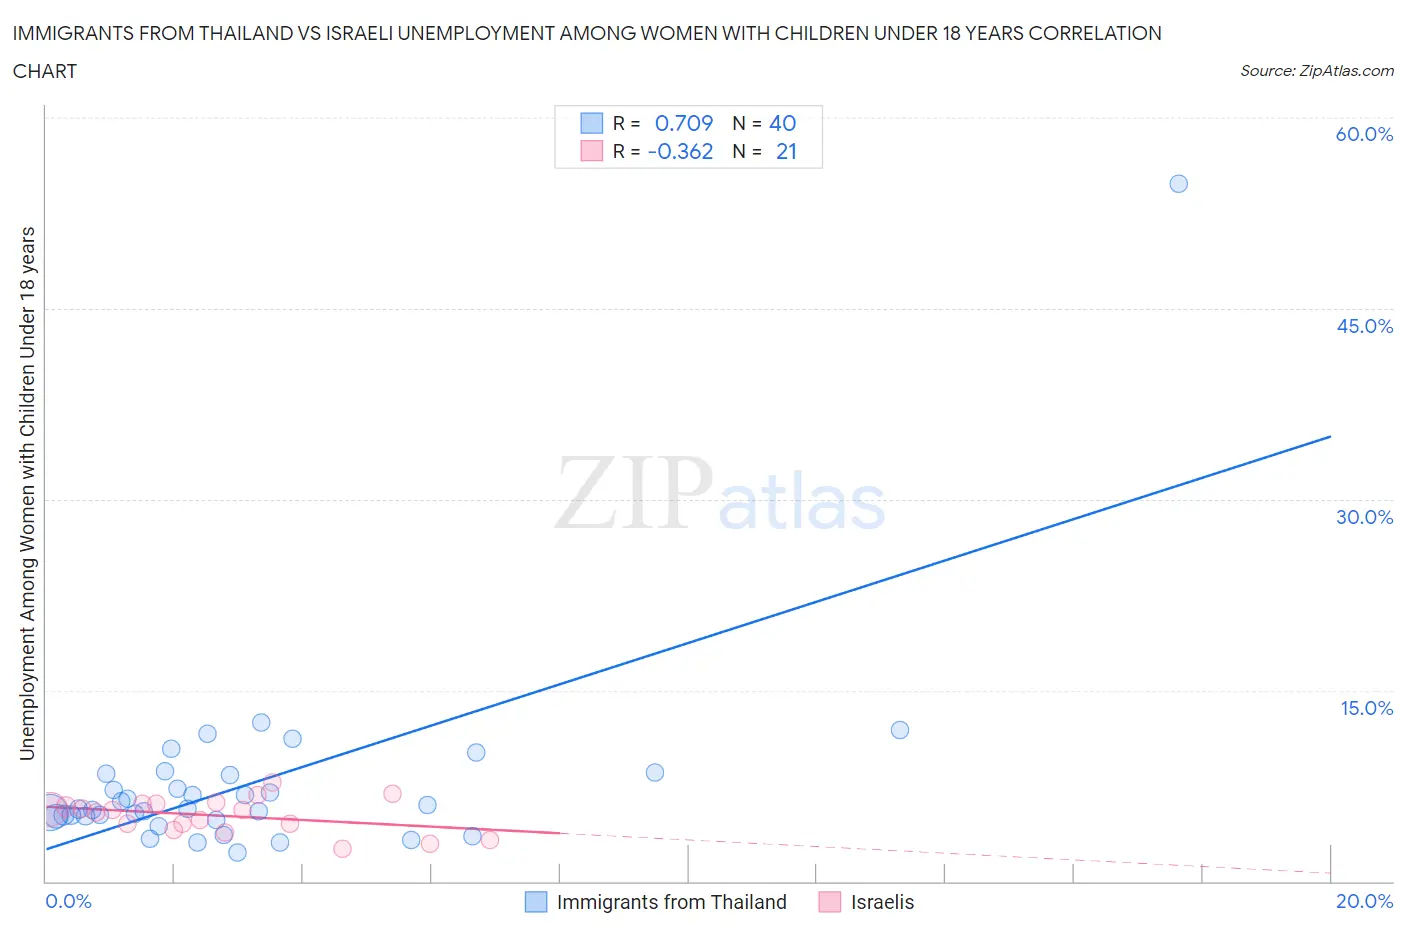
Immigrants from Thailand vs Israeli Unemployment Among Women with Children Under 18 years Correlation Chart
The statistical analysis conducted on geographies consisting of 308,715,578 people shows a strong positive correlation between the proportion of Immigrants from Thailand and unemployment rate among women with children under the age of 18 in the United States with a correlation coefficient (R) of 0.709 and weighted average of 5.4%. Similarly, the statistical analysis conducted on geographies consisting of 206,692,702 people shows a mild negative correlation between the proportion of Israelis and unemployment rate among women with children under the age of 18 in the United States with a correlation coefficient (R) of -0.362 and weighted average of 5.6%, a difference of 3.4%.
Unemployment Among Women with Children Under 18 years Correlation Summary
| Measurement | Immigrants from Thailand | Israeli |
| Minimum | 2.3% | 2.6% |
| Maximum | 54.8% | 7.8% |
| Range | 52.5% | 5.2% |
| Mean | 7.6% | 5.2% |
| Median | 5.7% | 5.5% |
| Interquartile 25% (IQ1) | 5.1% | 4.2% |
| Interquartile 75% (IQ3) | 8.4% | 6.1% |
| Interquartile Range (IQR) | 3.2% | 1.8% |
| Standard Deviation (Sample) | 8.1% | 1.4% |
| Standard Deviation (Population) | 8.0% | 1.3% |
Similar Demographics by Unemployment Among Women with Children Under 18 years
Demographics Similar to Immigrants from Thailand by Unemployment Among Women with Children Under 18 years
In terms of unemployment among women with children under 18 years, the demographic groups most similar to Immigrants from Thailand are Immigrants from Northern Africa (5.4%, a difference of 0.060%), Samoan (5.4%, a difference of 0.080%), Immigrants from Philippines (5.4%, a difference of 0.16%), Immigrants from Denmark (5.4%, a difference of 0.20%), and Immigrants from Kazakhstan (5.4%, a difference of 0.26%).
| Demographics | Rating | Rank | Unemployment Among Women with Children Under 18 years |
| Immigrants | Saudi Arabia | 65.0 /100 | #162 | Good 5.4% |
| Lebanese | 64.7 /100 | #163 | Good 5.4% |
| Celtics | 63.0 /100 | #164 | Good 5.4% |
| Tlingit-Haida | 61.9 /100 | #165 | Good 5.4% |
| Aleuts | 59.4 /100 | #166 | Average 5.4% |
| Immigrants | Denmark | 58.0 /100 | #167 | Average 5.4% |
| Immigrants | Northern Africa | 56.1 /100 | #168 | Average 5.4% |
| Immigrants | Thailand | 55.3 /100 | #169 | Average 5.4% |
| Samoans | 54.1 /100 | #170 | Average 5.4% |
| Immigrants | Philippines | 53.1 /100 | #171 | Average 5.4% |
| Immigrants | Kazakhstan | 51.7 /100 | #172 | Average 5.4% |
| Immigrants | Eastern Africa | 51.3 /100 | #173 | Average 5.4% |
| Immigrants | Uzbekistan | 50.0 /100 | #174 | Average 5.4% |
| Spanish | 49.0 /100 | #175 | Average 5.4% |
| Immigrants | Germany | 48.5 /100 | #176 | Average 5.5% |
Demographics Similar to Israelis by Unemployment Among Women with Children Under 18 years
In terms of unemployment among women with children under 18 years, the demographic groups most similar to Israelis are Portuguese (5.6%, a difference of 0.030%), Tsimshian (5.6%, a difference of 0.050%), Immigrants from Micronesia (5.6%, a difference of 0.18%), Immigrants from Morocco (5.6%, a difference of 0.27%), and Menominee (5.6%, a difference of 0.36%).
| Demographics | Rating | Rank | Unemployment Among Women with Children Under 18 years |
| Immigrants | Colombia | 21.4 /100 | #197 | Fair 5.6% |
| Arabs | 21.4 /100 | #198 | Fair 5.6% |
| Marshallese | 20.2 /100 | #199 | Fair 5.6% |
| Menominee | 18.6 /100 | #200 | Poor 5.6% |
| Immigrants | Morocco | 17.9 /100 | #201 | Poor 5.6% |
| Immigrants | Micronesia | 17.1 /100 | #202 | Poor 5.6% |
| Portuguese | 15.9 /100 | #203 | Poor 5.6% |
| Israelis | 15.6 /100 | #204 | Poor 5.6% |
| Tsimshian | 15.2 /100 | #205 | Poor 5.6% |
| Nicaraguans | 12.3 /100 | #206 | Poor 5.6% |
| Peruvians | 12.1 /100 | #207 | Poor 5.6% |
| Immigrants | Costa Rica | 11.6 /100 | #208 | Poor 5.6% |
| Immigrants | Western Asia | 11.3 /100 | #209 | Poor 5.6% |
| Immigrants | Nonimmigrants | 10.6 /100 | #210 | Poor 5.7% |
| Panamanians | 10.1 /100 | #211 | Poor 5.7% |