Immigrants from Thailand vs Immigrants from Eritrea Unemployment Among Women with Children Under 18 years
COMPARE
Immigrants from Thailand
Immigrants from Eritrea
Unemployment Among Women with Children Under 18 years
Unemployment Among Women with Children Under 18 years Comparison
Immigrants from Thailand
Immigrants from Eritrea
5.4%
UNEMPLOYMENT AMONG WOMEN WITH CHILDREN UNDER 18 YEARS
55.3/ 100
METRIC RATING
169th/ 347
METRIC RANK
5.5%
UNEMPLOYMENT AMONG WOMEN WITH CHILDREN UNDER 18 YEARS
33.8/ 100
METRIC RATING
189th/ 347
METRIC RANK
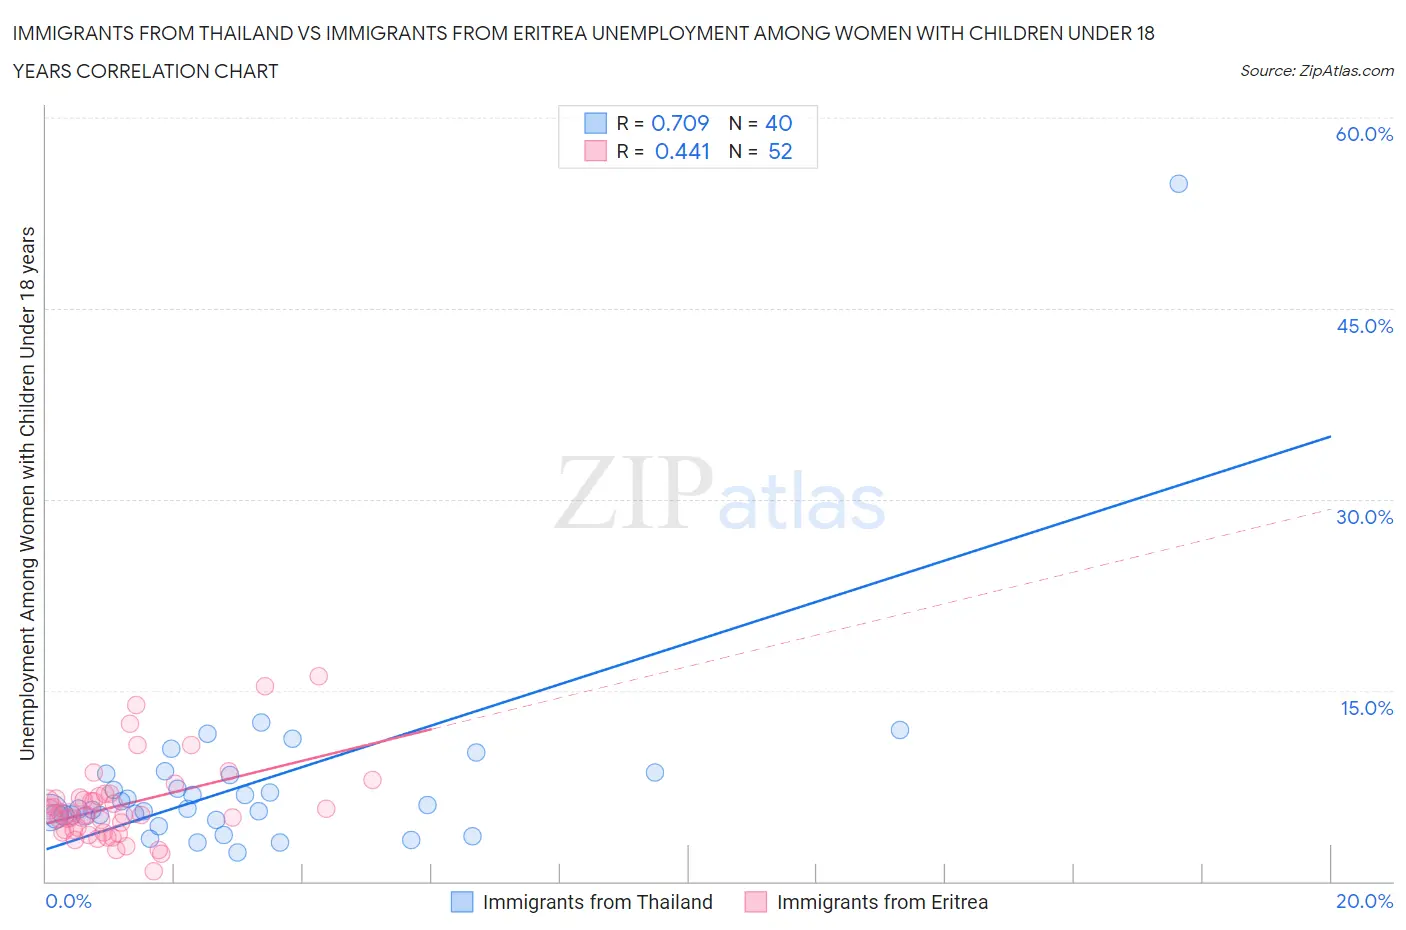
Immigrants from Thailand vs Immigrants from Eritrea Unemployment Among Women with Children Under 18 years Correlation Chart
The statistical analysis conducted on geographies consisting of 308,715,578 people shows a strong positive correlation between the proportion of Immigrants from Thailand and unemployment rate among women with children under the age of 18 in the United States with a correlation coefficient (R) of 0.709 and weighted average of 5.4%. Similarly, the statistical analysis conducted on geographies consisting of 103,960,003 people shows a moderate positive correlation between the proportion of Immigrants from Eritrea and unemployment rate among women with children under the age of 18 in the United States with a correlation coefficient (R) of 0.441 and weighted average of 5.5%, a difference of 1.6%.
Unemployment Among Women with Children Under 18 years Correlation Summary
| Measurement | Immigrants from Thailand | Immigrants from Eritrea |
| Minimum | 2.3% | 0.80% |
| Maximum | 54.8% | 16.1% |
| Range | 52.5% | 15.3% |
| Mean | 7.6% | 6.0% |
| Median | 5.7% | 5.3% |
| Interquartile 25% (IQ1) | 5.1% | 4.0% |
| Interquartile 75% (IQ3) | 8.4% | 6.6% |
| Interquartile Range (IQR) | 3.2% | 2.7% |
| Standard Deviation (Sample) | 8.1% | 3.2% |
| Standard Deviation (Population) | 8.0% | 3.1% |
Demographics Similar to Immigrants from Thailand and Immigrants from Eritrea by Unemployment Among Women with Children Under 18 years
In terms of unemployment among women with children under 18 years, the demographic groups most similar to Immigrants from Thailand are Samoan (5.4%, a difference of 0.080%), Immigrants from Philippines (5.4%, a difference of 0.16%), Immigrants from Kazakhstan (5.4%, a difference of 0.26%), Immigrants from Eastern Africa (5.4%, a difference of 0.28%), and Immigrants from Uzbekistan (5.4%, a difference of 0.38%). Similarly, the demographic groups most similar to Immigrants from Eritrea are Iraqi (5.5%, a difference of 0.12%), Malaysian (5.5%, a difference of 0.15%), Indonesian (5.5%, a difference of 0.20%), Immigrants from Zaire (5.5%, a difference of 0.33%), and Immigrants from Cambodia (5.5%, a difference of 0.35%).
| Demographics | Rating | Rank | Unemployment Among Women with Children Under 18 years |
| Immigrants | Thailand | 55.3 /100 | #169 | Average 5.4% |
| Samoans | 54.1 /100 | #170 | Average 5.4% |
| Immigrants | Philippines | 53.1 /100 | #171 | Average 5.4% |
| Immigrants | Kazakhstan | 51.7 /100 | #172 | Average 5.4% |
| Immigrants | Eastern Africa | 51.3 /100 | #173 | Average 5.4% |
| Immigrants | Uzbekistan | 50.0 /100 | #174 | Average 5.4% |
| Spanish | 49.0 /100 | #175 | Average 5.4% |
| Immigrants | Germany | 48.5 /100 | #176 | Average 5.5% |
| Hawaiians | 46.1 /100 | #177 | Average 5.5% |
| Costa Ricans | 45.2 /100 | #178 | Average 5.5% |
| Syrians | 42.8 /100 | #179 | Average 5.5% |
| Immigrants | Southern Europe | 42.7 /100 | #180 | Average 5.5% |
| Immigrants | Hungary | 41.3 /100 | #181 | Average 5.5% |
| Immigrants | Sudan | 40.6 /100 | #182 | Average 5.5% |
| Immigrants | Laos | 38.8 /100 | #183 | Fair 5.5% |
| Immigrants | Cambodia | 38.4 /100 | #184 | Fair 5.5% |
| Immigrants | Zaire | 38.1 /100 | #185 | Fair 5.5% |
| Indonesians | 36.3 /100 | #186 | Fair 5.5% |
| Malaysians | 35.7 /100 | #187 | Fair 5.5% |
| Iraqis | 35.3 /100 | #188 | Fair 5.5% |
| Immigrants | Eritrea | 33.8 /100 | #189 | Fair 5.5% |