Immigrants from Syria vs Immigrants from Guatemala Unemployment Among Youth under 25 years
COMPARE
Immigrants from Syria
Immigrants from Guatemala
Unemployment Among Youth under 25 years
Unemployment Among Youth under 25 years Comparison
Immigrants from Syria
Immigrants from Guatemala
12.3%
UNEMPLOYMENT AMONG YOUTH UNDER 25 YEARS
0.3/ 100
METRIC RATING
252nd/ 347
METRIC RANK
12.1%
UNEMPLOYMENT AMONG YOUTH UNDER 25 YEARS
1.4/ 100
METRIC RATING
235th/ 347
METRIC RANK
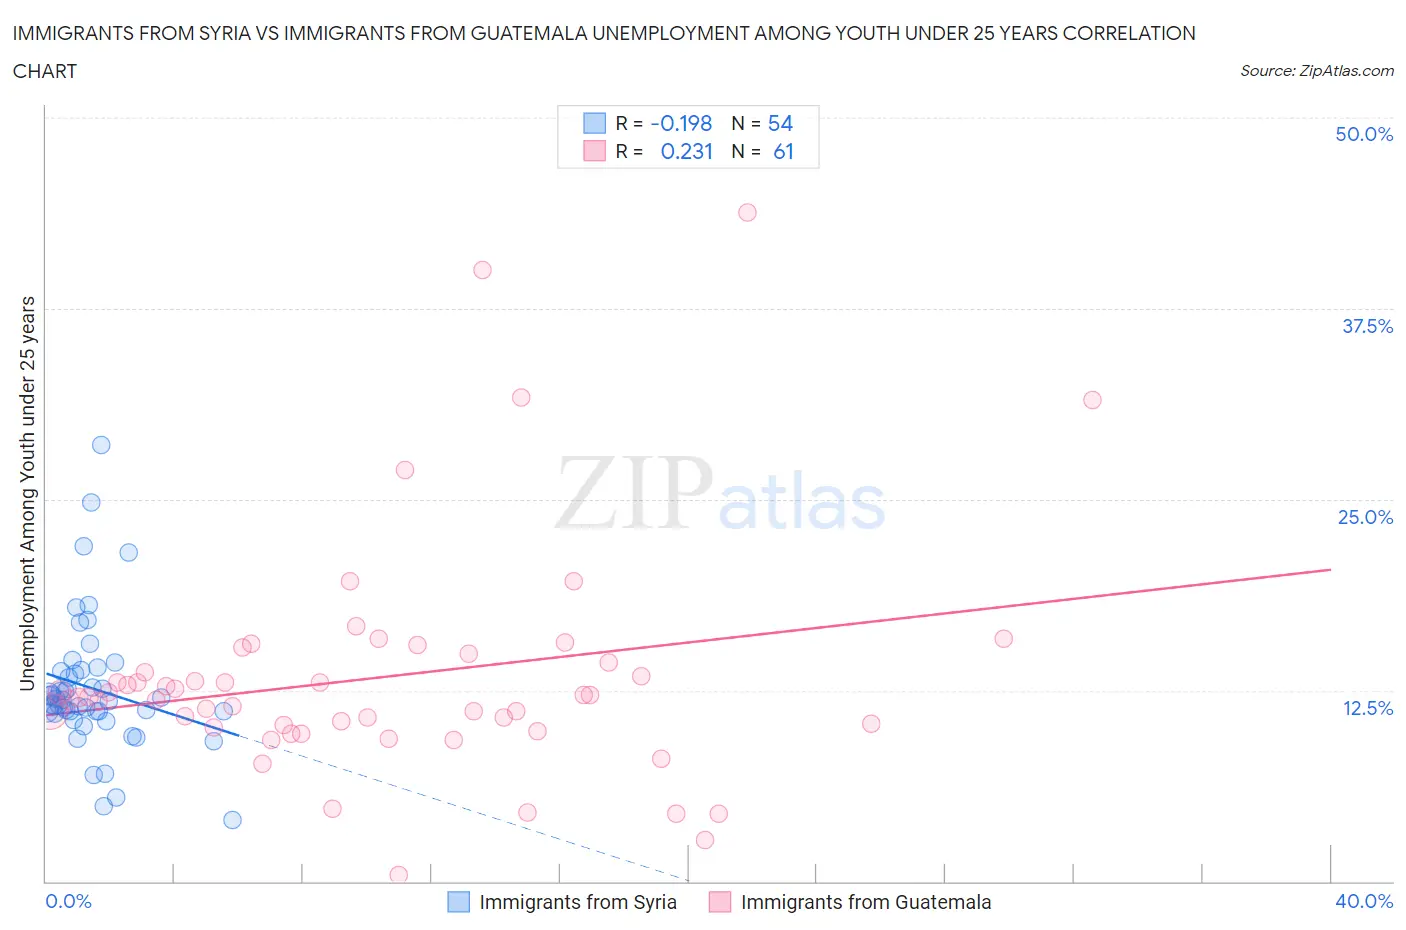
Immigrants from Syria vs Immigrants from Guatemala Unemployment Among Youth under 25 years Correlation Chart
The statistical analysis conducted on geographies consisting of 173,556,905 people shows a poor negative correlation between the proportion of Immigrants from Syria and unemployment rate among youth under the age of 25 in the United States with a correlation coefficient (R) of -0.198 and weighted average of 12.3%. Similarly, the statistical analysis conducted on geographies consisting of 373,807,497 people shows a weak positive correlation between the proportion of Immigrants from Guatemala and unemployment rate among youth under the age of 25 in the United States with a correlation coefficient (R) of 0.231 and weighted average of 12.1%, a difference of 1.4%.
Unemployment Among Youth under 25 years Correlation Summary
| Measurement | Immigrants from Syria | Immigrants from Guatemala |
| Minimum | 4.0% | 0.40% |
| Maximum | 28.6% | 43.8% |
| Range | 24.6% | 43.4% |
| Mean | 12.6% | 13.4% |
| Median | 11.9% | 12.0% |
| Interquartile 25% (IQ1) | 11.1% | 10.1% |
| Interquartile 75% (IQ3) | 13.7% | 14.6% |
| Interquartile Range (IQR) | 2.6% | 4.5% |
| Standard Deviation (Sample) | 4.4% | 7.6% |
| Standard Deviation (Population) | 4.3% | 7.5% |
Demographics Similar to Immigrants from Syria and Immigrants from Guatemala by Unemployment Among Youth under 25 years
In terms of unemployment among youth under 25 years, the demographic groups most similar to Immigrants from Syria are Mexican American Indian (12.3%, a difference of 0.040%), Mexican (12.3%, a difference of 0.040%), Delaware (12.3%, a difference of 0.070%), Soviet Union (12.2%, a difference of 0.49%), and Central American (12.2%, a difference of 0.50%). Similarly, the demographic groups most similar to Immigrants from Guatemala are Guatemalan (12.1%, a difference of 0.020%), Immigrants (12.1%, a difference of 0.040%), Native Hawaiian (12.1%, a difference of 0.060%), Albanian (12.1%, a difference of 0.12%), and South American Indian (12.1%, a difference of 0.16%).
| Demographics | Rating | Rank | Unemployment Among Youth under 25 years |
| South American Indians | 1.6 /100 | #233 | Tragic 12.1% |
| Guatemalans | 1.4 /100 | #234 | Tragic 12.1% |
| Immigrants | Guatemala | 1.4 /100 | #235 | Tragic 12.1% |
| Immigrants | Immigrants | 1.3 /100 | #236 | Tragic 12.1% |
| Native Hawaiians | 1.3 /100 | #237 | Tragic 12.1% |
| Albanians | 1.2 /100 | #238 | Tragic 12.1% |
| Immigrants | Africa | 1.1 /100 | #239 | Tragic 12.1% |
| Dutch West Indians | 1.1 /100 | #240 | Tragic 12.1% |
| Immigrants | Albania | 1.1 /100 | #241 | Tragic 12.1% |
| Immigrants | Western Asia | 0.8 /100 | #242 | Tragic 12.2% |
| Immigrants | Azores | 0.6 /100 | #243 | Tragic 12.2% |
| Alaskan Athabascans | 0.6 /100 | #244 | Tragic 12.2% |
| Spanish Americans | 0.6 /100 | #245 | Tragic 12.2% |
| Immigrants | Honduras | 0.6 /100 | #246 | Tragic 12.2% |
| Immigrants | Greece | 0.6 /100 | #247 | Tragic 12.2% |
| Central Americans | 0.6 /100 | #248 | Tragic 12.2% |
| Soviet Union | 0.6 /100 | #249 | Tragic 12.2% |
| Delaware | 0.4 /100 | #250 | Tragic 12.3% |
| Mexican American Indians | 0.4 /100 | #251 | Tragic 12.3% |
| Immigrants | Syria | 0.3 /100 | #252 | Tragic 12.3% |
| Mexicans | 0.3 /100 | #253 | Tragic 12.3% |