Carpatho Rusyn vs Immigrants from Guatemala Unemployment Among Youth under 25 years
COMPARE
Carpatho Rusyn
Immigrants from Guatemala
Unemployment Among Youth under 25 years
Unemployment Among Youth under 25 years Comparison
Carpatho Rusyns
Immigrants from Guatemala
11.3%
UNEMPLOYMENT AMONG YOUTH UNDER 25 YEARS
94.4/ 100
METRIC RATING
95th/ 347
METRIC RANK
12.1%
UNEMPLOYMENT AMONG YOUTH UNDER 25 YEARS
1.4/ 100
METRIC RATING
235th/ 347
METRIC RANK
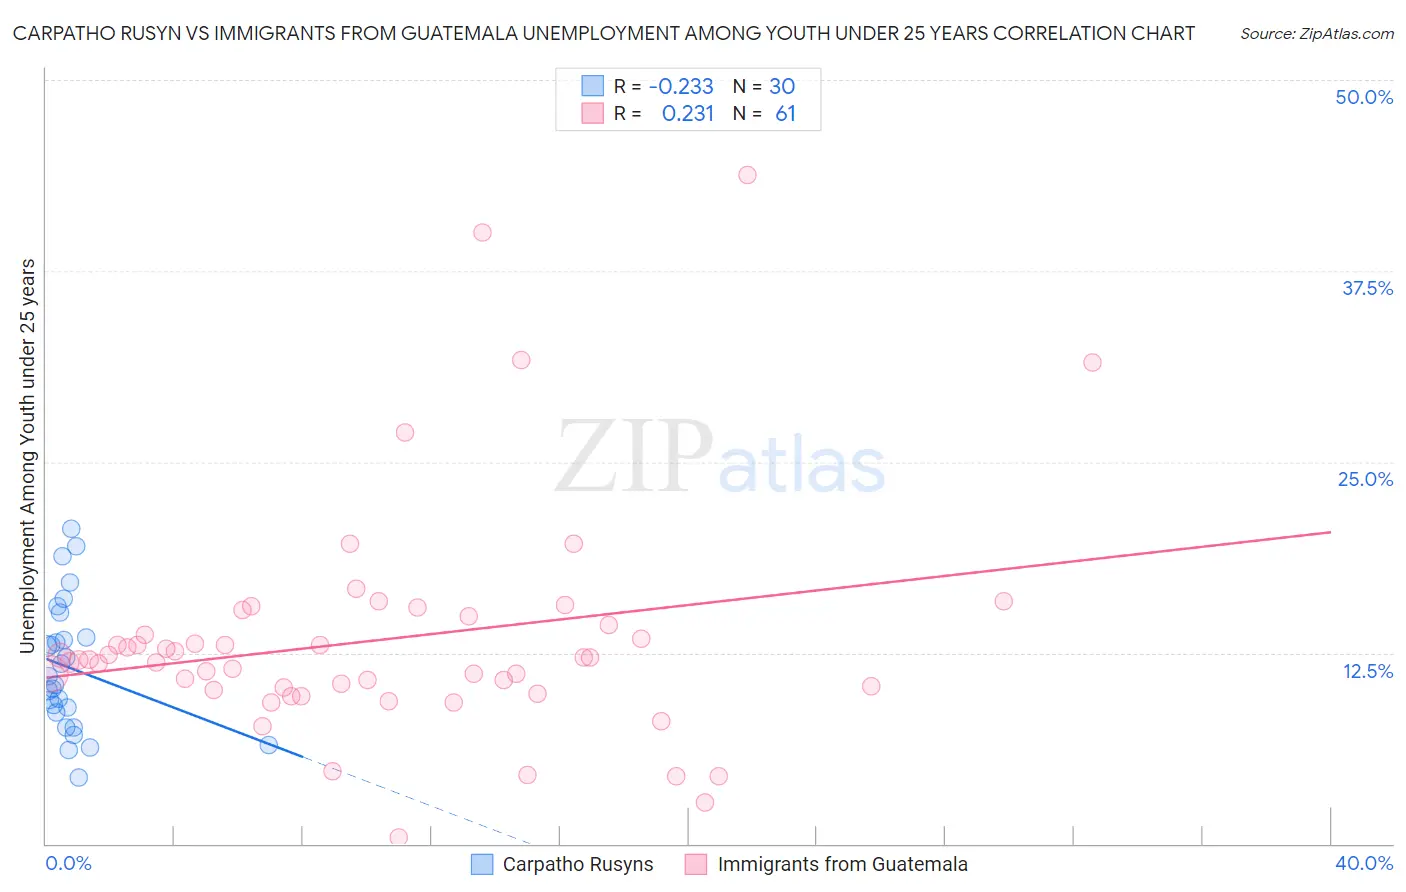
Carpatho Rusyn vs Immigrants from Guatemala Unemployment Among Youth under 25 years Correlation Chart
The statistical analysis conducted on geographies consisting of 58,593,432 people shows a weak negative correlation between the proportion of Carpatho Rusyns and unemployment rate among youth under the age of 25 in the United States with a correlation coefficient (R) of -0.233 and weighted average of 11.3%. Similarly, the statistical analysis conducted on geographies consisting of 373,807,497 people shows a weak positive correlation between the proportion of Immigrants from Guatemala and unemployment rate among youth under the age of 25 in the United States with a correlation coefficient (R) of 0.231 and weighted average of 12.1%, a difference of 7.5%.
Unemployment Among Youth under 25 years Correlation Summary
| Measurement | Carpatho Rusyn | Immigrants from Guatemala |
| Minimum | 4.3% | 0.40% |
| Maximum | 20.6% | 43.8% |
| Range | 16.3% | 43.4% |
| Mean | 11.5% | 13.4% |
| Median | 10.7% | 12.0% |
| Interquartile 25% (IQ1) | 8.6% | 10.1% |
| Interquartile 75% (IQ3) | 13.5% | 14.6% |
| Interquartile Range (IQR) | 4.9% | 4.5% |
| Standard Deviation (Sample) | 4.2% | 7.6% |
| Standard Deviation (Population) | 4.1% | 7.5% |
Similar Demographics by Unemployment Among Youth under 25 years
Demographics Similar to Carpatho Rusyns by Unemployment Among Youth under 25 years
In terms of unemployment among youth under 25 years, the demographic groups most similar to Carpatho Rusyns are Immigrants from Serbia (11.3%, a difference of 0.010%), Nicaraguan (11.3%, a difference of 0.030%), Estonian (11.3%, a difference of 0.040%), Lithuanian (11.3%, a difference of 0.070%), and Celtic (11.3%, a difference of 0.090%).
| Demographics | Rating | Rank | Unemployment Among Youth under 25 years |
| Austrians | 95.5 /100 | #88 | Exceptional 11.2% |
| Immigrants | Japan | 95.5 /100 | #89 | Exceptional 11.2% |
| Immigrants | Bolivia | 95.5 /100 | #90 | Exceptional 11.2% |
| Immigrants | Taiwan | 95.1 /100 | #91 | Exceptional 11.2% |
| Immigrants | Latvia | 95.1 /100 | #92 | Exceptional 11.2% |
| Immigrants | North America | 95.1 /100 | #93 | Exceptional 11.2% |
| Lithuanians | 94.8 /100 | #94 | Exceptional 11.3% |
| Carpatho Rusyns | 94.4 /100 | #95 | Exceptional 11.3% |
| Immigrants | Serbia | 94.4 /100 | #96 | Exceptional 11.3% |
| Nicaraguans | 94.3 /100 | #97 | Exceptional 11.3% |
| Estonians | 94.2 /100 | #98 | Exceptional 11.3% |
| Celtics | 94.0 /100 | #99 | Exceptional 11.3% |
| Pakistanis | 94.0 /100 | #100 | Exceptional 11.3% |
| Iroquois | 93.8 /100 | #101 | Exceptional 11.3% |
| Immigrants | Thailand | 93.6 /100 | #102 | Exceptional 11.3% |
Demographics Similar to Immigrants from Guatemala by Unemployment Among Youth under 25 years
In terms of unemployment among youth under 25 years, the demographic groups most similar to Immigrants from Guatemala are Guatemalan (12.1%, a difference of 0.020%), Immigrants (12.1%, a difference of 0.040%), Native Hawaiian (12.1%, a difference of 0.060%), Albanian (12.1%, a difference of 0.12%), and South American Indian (12.1%, a difference of 0.16%).
| Demographics | Rating | Rank | Unemployment Among Youth under 25 years |
| Immigrants | Fiji | 2.1 /100 | #228 | Tragic 12.1% |
| Moroccans | 2.1 /100 | #229 | Tragic 12.1% |
| Choctaw | 1.9 /100 | #230 | Tragic 12.1% |
| Immigrants | South America | 1.8 /100 | #231 | Tragic 12.1% |
| Immigrants | Belarus | 1.6 /100 | #232 | Tragic 12.1% |
| South American Indians | 1.6 /100 | #233 | Tragic 12.1% |
| Guatemalans | 1.4 /100 | #234 | Tragic 12.1% |
| Immigrants | Guatemala | 1.4 /100 | #235 | Tragic 12.1% |
| Immigrants | Immigrants | 1.3 /100 | #236 | Tragic 12.1% |
| Native Hawaiians | 1.3 /100 | #237 | Tragic 12.1% |
| Albanians | 1.2 /100 | #238 | Tragic 12.1% |
| Immigrants | Africa | 1.1 /100 | #239 | Tragic 12.1% |
| Dutch West Indians | 1.1 /100 | #240 | Tragic 12.1% |
| Immigrants | Albania | 1.1 /100 | #241 | Tragic 12.1% |
| Immigrants | Western Asia | 0.8 /100 | #242 | Tragic 12.2% |