Immigrants from St. Vincent and the Grenadines vs Armenian Unemployment Among Ages 30 to 34 years
COMPARE
Immigrants from St. Vincent and the Grenadines
Armenian
Unemployment Among Ages 30 to 34 years
Unemployment Among Ages 30 to 34 years Comparison
Immigrants from St. Vincent and the Grenadines
Armenians
7.0%
UNEMPLOYMENT AMONG AGES 30 TO 34 YEARS
0.0/ 100
METRIC RATING
310th/ 347
METRIC RANK
6.1%
UNEMPLOYMENT AMONG AGES 30 TO 34 YEARS
0.1/ 100
METRIC RATING
254th/ 347
METRIC RANK
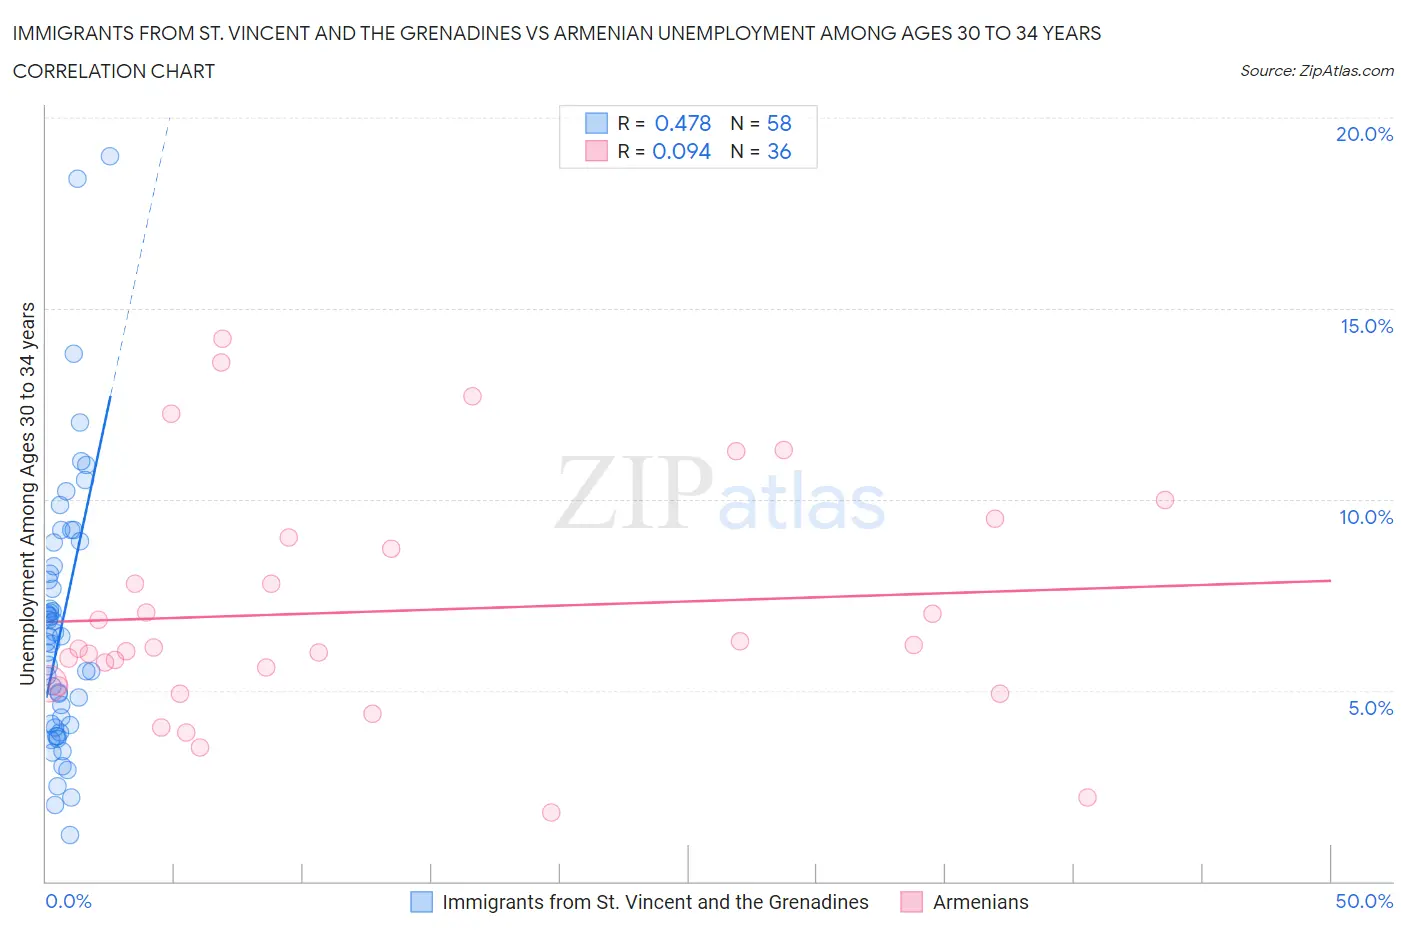
Immigrants from St. Vincent and the Grenadines vs Armenian Unemployment Among Ages 30 to 34 years Correlation Chart
The statistical analysis conducted on geographies consisting of 55,642,610 people shows a moderate positive correlation between the proportion of Immigrants from St. Vincent and the Grenadines and unemployment rate among population between the ages 30 and 34 in the United States with a correlation coefficient (R) of 0.478 and weighted average of 7.0%. Similarly, the statistical analysis conducted on geographies consisting of 295,669,419 people shows a slight positive correlation between the proportion of Armenians and unemployment rate among population between the ages 30 and 34 in the United States with a correlation coefficient (R) of 0.094 and weighted average of 6.1%, a difference of 14.2%.
Unemployment Among Ages 30 to 34 years Correlation Summary
| Measurement | Immigrants from St. Vincent and the Grenadines | Armenian |
| Minimum | 1.2% | 1.8% |
| Maximum | 19.0% | 14.2% |
| Range | 17.8% | 12.4% |
| Mean | 6.7% | 7.1% |
| Median | 6.3% | 6.1% |
| Interquartile 25% (IQ1) | 4.1% | 5.2% |
| Interquartile 75% (IQ3) | 8.2% | 8.8% |
| Interquartile Range (IQR) | 4.1% | 3.7% |
| Standard Deviation (Sample) | 3.5% | 3.1% |
| Standard Deviation (Population) | 3.5% | 3.0% |
Similar Demographics by Unemployment Among Ages 30 to 34 years
Demographics Similar to Immigrants from St. Vincent and the Grenadines by Unemployment Among Ages 30 to 34 years
In terms of unemployment among ages 30 to 34 years, the demographic groups most similar to Immigrants from St. Vincent and the Grenadines are Immigrants from Grenada (6.9%, a difference of 0.36%), Immigrants from the Azores (6.9%, a difference of 1.0%), Alaskan Athabascan (7.0%, a difference of 1.1%), British West Indian (7.0%, a difference of 1.1%), and Ute (7.0%, a difference of 1.2%).
| Demographics | Rating | Rank | Unemployment Among Ages 30 to 34 years |
| Cajuns | 0.0 /100 | #303 | Tragic 6.7% |
| Kiowa | 0.0 /100 | #304 | Tragic 6.7% |
| Paiute | 0.0 /100 | #305 | Tragic 6.7% |
| Immigrants | Armenia | 0.0 /100 | #306 | Tragic 6.8% |
| Immigrants | Belize | 0.0 /100 | #307 | Tragic 6.9% |
| Immigrants | Azores | 0.0 /100 | #308 | Tragic 6.9% |
| Immigrants | Grenada | 0.0 /100 | #309 | Tragic 6.9% |
| Immigrants | St. Vincent and the Grenadines | 0.0 /100 | #310 | Tragic 7.0% |
| Alaskan Athabascans | 0.0 /100 | #311 | Tragic 7.0% |
| British West Indians | 0.0 /100 | #312 | Tragic 7.0% |
| Ute | 0.0 /100 | #313 | Tragic 7.0% |
| Lumbee | 0.0 /100 | #314 | Tragic 7.1% |
| Aleuts | 0.0 /100 | #315 | Tragic 7.1% |
| Houma | 0.0 /100 | #316 | Tragic 7.2% |
| Immigrants | Cabo Verde | 0.0 /100 | #317 | Tragic 7.2% |
Demographics Similar to Armenians by Unemployment Among Ages 30 to 34 years
In terms of unemployment among ages 30 to 34 years, the demographic groups most similar to Armenians are Immigrants from Portugal (6.1%, a difference of 0.31%), Immigrants from Ghana (6.1%, a difference of 0.51%), Immigrants from Sierra Leone (6.1%, a difference of 0.55%), Mexican (6.1%, a difference of 0.62%), and Nonimmigrants (6.1%, a difference of 0.63%).
| Demographics | Rating | Rank | Unemployment Among Ages 30 to 34 years |
| Nigerians | 0.3 /100 | #247 | Tragic 6.0% |
| Immigrants | Guatemala | 0.3 /100 | #248 | Tragic 6.0% |
| Hondurans | 0.3 /100 | #249 | Tragic 6.0% |
| Immigrants | Honduras | 0.3 /100 | #250 | Tragic 6.0% |
| Tlingit-Haida | 0.2 /100 | #251 | Tragic 6.0% |
| Potawatomi | 0.2 /100 | #252 | Tragic 6.0% |
| Immigrants | Nonimmigrants | 0.2 /100 | #253 | Tragic 6.1% |
| Armenians | 0.1 /100 | #254 | Tragic 6.1% |
| Immigrants | Portugal | 0.1 /100 | #255 | Tragic 6.1% |
| Immigrants | Ghana | 0.1 /100 | #256 | Tragic 6.1% |
| Immigrants | Sierra Leone | 0.1 /100 | #257 | Tragic 6.1% |
| Mexicans | 0.1 /100 | #258 | Tragic 6.1% |
| Haitians | 0.1 /100 | #259 | Tragic 6.1% |
| Immigrants | Latin America | 0.1 /100 | #260 | Tragic 6.1% |
| Immigrants | Western Africa | 0.1 /100 | #261 | Tragic 6.2% |