German Russian vs Armenian Unemployment Among Ages 30 to 34 years
COMPARE
German Russian
Armenian
Unemployment Among Ages 30 to 34 years
Unemployment Among Ages 30 to 34 years Comparison
German Russians
Armenians
5.0%
UNEMPLOYMENT AMONG AGES 30 TO 34 YEARS
99.4/ 100
METRIC RATING
29th/ 347
METRIC RANK
6.1%
UNEMPLOYMENT AMONG AGES 30 TO 34 YEARS
0.1/ 100
METRIC RATING
254th/ 347
METRIC RANK
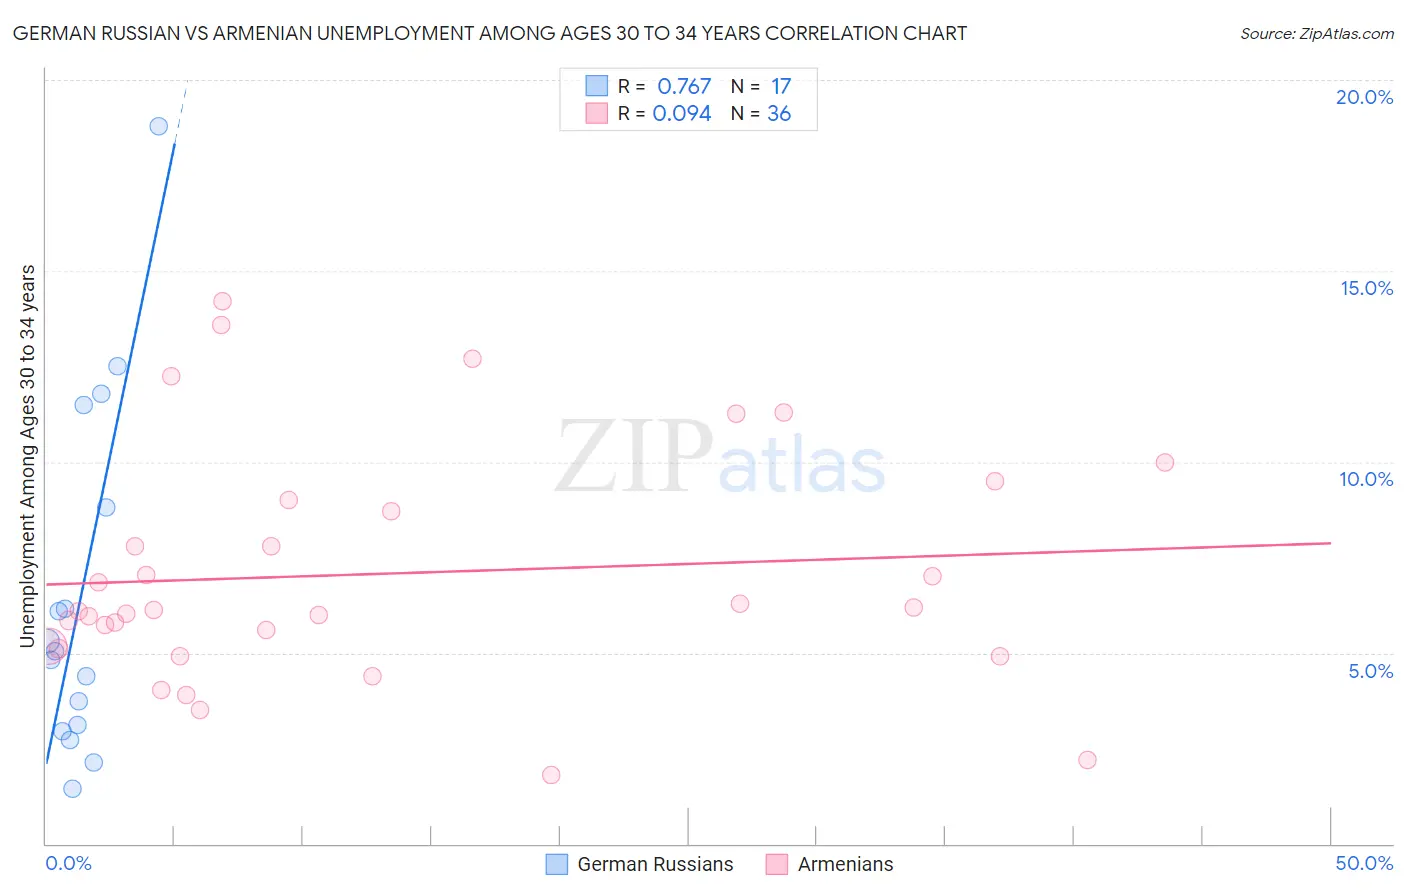
German Russian vs Armenian Unemployment Among Ages 30 to 34 years Correlation Chart
The statistical analysis conducted on geographies consisting of 94,856,577 people shows a strong positive correlation between the proportion of German Russians and unemployment rate among population between the ages 30 and 34 in the United States with a correlation coefficient (R) of 0.767 and weighted average of 5.0%. Similarly, the statistical analysis conducted on geographies consisting of 295,669,419 people shows a slight positive correlation between the proportion of Armenians and unemployment rate among population between the ages 30 and 34 in the United States with a correlation coefficient (R) of 0.094 and weighted average of 6.1%, a difference of 22.3%.
Unemployment Among Ages 30 to 34 years Correlation Summary
| Measurement | German Russian | Armenian |
| Minimum | 1.5% | 1.8% |
| Maximum | 18.8% | 14.2% |
| Range | 17.3% | 12.4% |
| Mean | 6.5% | 7.1% |
| Median | 5.0% | 6.1% |
| Interquartile 25% (IQ1) | 3.0% | 5.2% |
| Interquartile 75% (IQ3) | 10.2% | 8.8% |
| Interquartile Range (IQR) | 7.1% | 3.7% |
| Standard Deviation (Sample) | 4.7% | 3.1% |
| Standard Deviation (Population) | 4.5% | 3.0% |
Similar Demographics by Unemployment Among Ages 30 to 34 years
Demographics Similar to German Russians by Unemployment Among Ages 30 to 34 years
In terms of unemployment among ages 30 to 34 years, the demographic groups most similar to German Russians are Immigrants from Cuba (5.0%, a difference of 0.020%), Norwegian (5.0%, a difference of 0.020%), Somali (5.0%, a difference of 0.11%), Immigrants from Zaire (5.0%, a difference of 0.15%), and Immigrants from Saudi Arabia (5.0%, a difference of 0.25%).
| Demographics | Rating | Rank | Unemployment Among Ages 30 to 34 years |
| Immigrants | South Central Asia | 99.8 /100 | #22 | Exceptional 4.9% |
| Hmong | 99.8 /100 | #23 | Exceptional 4.9% |
| Ugandans | 99.7 /100 | #24 | Exceptional 4.9% |
| Immigrants | Singapore | 99.5 /100 | #25 | Exceptional 5.0% |
| Immigrants | Kuwait | 99.5 /100 | #26 | Exceptional 5.0% |
| Danes | 99.5 /100 | #27 | Exceptional 5.0% |
| Immigrants | Cuba | 99.4 /100 | #28 | Exceptional 5.0% |
| German Russians | 99.4 /100 | #29 | Exceptional 5.0% |
| Norwegians | 99.4 /100 | #30 | Exceptional 5.0% |
| Somalis | 99.3 /100 | #31 | Exceptional 5.0% |
| Immigrants | Zaire | 99.3 /100 | #32 | Exceptional 5.0% |
| Immigrants | Saudi Arabia | 99.3 /100 | #33 | Exceptional 5.0% |
| Latvians | 99.3 /100 | #34 | Exceptional 5.0% |
| Immigrants | Ethiopia | 99.2 /100 | #35 | Exceptional 5.0% |
| Czechs | 99.2 /100 | #36 | Exceptional 5.0% |
Demographics Similar to Armenians by Unemployment Among Ages 30 to 34 years
In terms of unemployment among ages 30 to 34 years, the demographic groups most similar to Armenians are Immigrants from Portugal (6.1%, a difference of 0.31%), Immigrants from Ghana (6.1%, a difference of 0.51%), Immigrants from Sierra Leone (6.1%, a difference of 0.55%), Mexican (6.1%, a difference of 0.62%), and Nonimmigrants (6.1%, a difference of 0.63%).
| Demographics | Rating | Rank | Unemployment Among Ages 30 to 34 years |
| Nigerians | 0.3 /100 | #247 | Tragic 6.0% |
| Immigrants | Guatemala | 0.3 /100 | #248 | Tragic 6.0% |
| Hondurans | 0.3 /100 | #249 | Tragic 6.0% |
| Immigrants | Honduras | 0.3 /100 | #250 | Tragic 6.0% |
| Tlingit-Haida | 0.2 /100 | #251 | Tragic 6.0% |
| Potawatomi | 0.2 /100 | #252 | Tragic 6.0% |
| Immigrants | Nonimmigrants | 0.2 /100 | #253 | Tragic 6.1% |
| Armenians | 0.1 /100 | #254 | Tragic 6.1% |
| Immigrants | Portugal | 0.1 /100 | #255 | Tragic 6.1% |
| Immigrants | Ghana | 0.1 /100 | #256 | Tragic 6.1% |
| Immigrants | Sierra Leone | 0.1 /100 | #257 | Tragic 6.1% |
| Mexicans | 0.1 /100 | #258 | Tragic 6.1% |
| Haitians | 0.1 /100 | #259 | Tragic 6.1% |
| Immigrants | Latin America | 0.1 /100 | #260 | Tragic 6.1% |
| Immigrants | Western Africa | 0.1 /100 | #261 | Tragic 6.2% |