Immigrants from Spain vs Ukrainian Unemployment Among Ages 60 to 64 years
COMPARE
Immigrants from Spain
Ukrainian
Unemployment Among Ages 60 to 64 years
Unemployment Among Ages 60 to 64 years Comparison
Immigrants from Spain
Ukrainians
5.2%
UNEMPLOYMENT AMONG AGES 60 TO 64 YEARS
0.1/ 100
METRIC RATING
273rd/ 347
METRIC RANK
4.7%
UNEMPLOYMENT AMONG AGES 60 TO 64 YEARS
96.1/ 100
METRIC RATING
118th/ 347
METRIC RANK
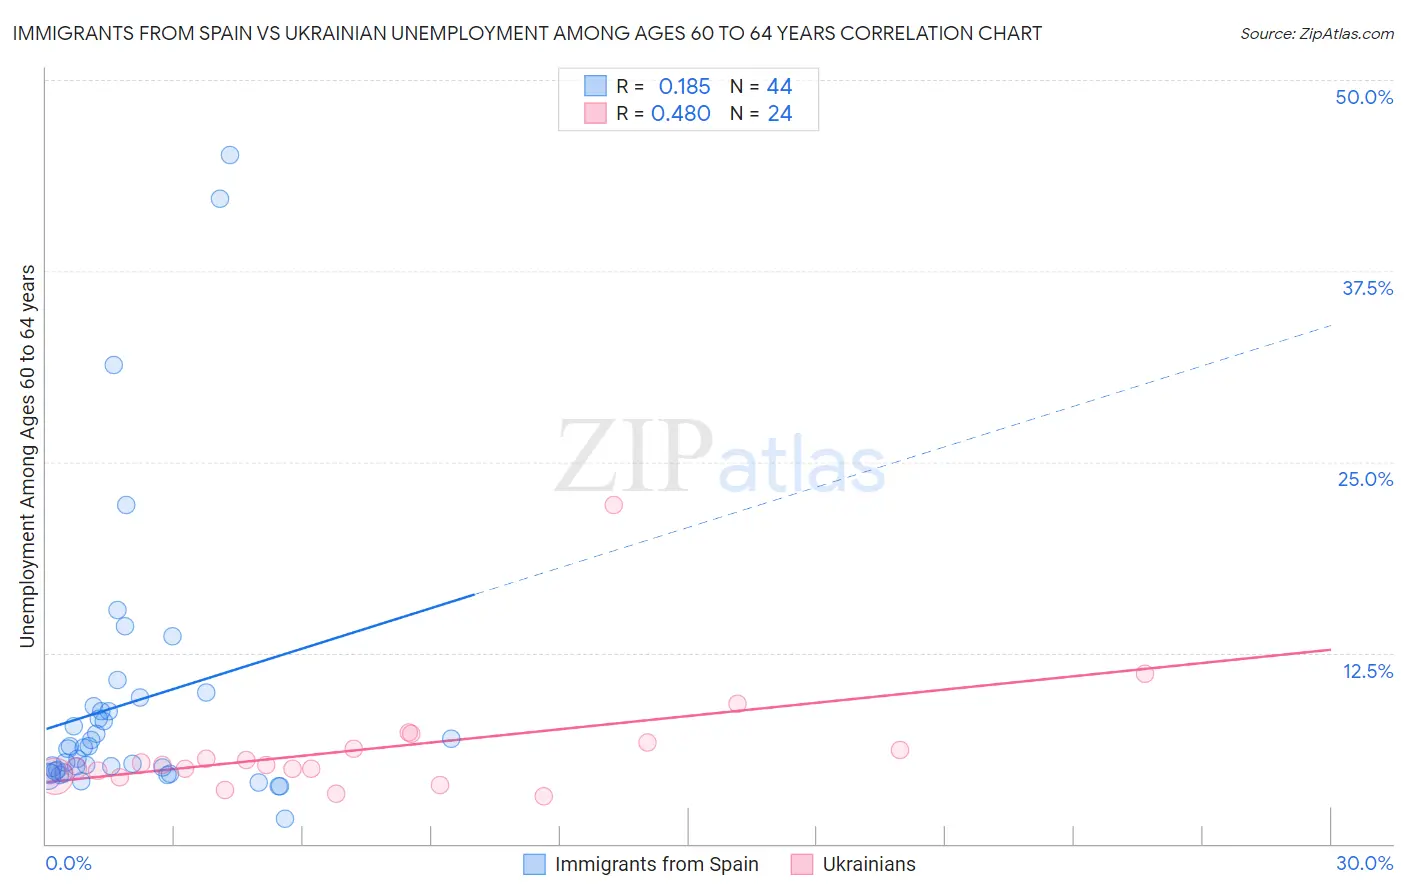
Immigrants from Spain vs Ukrainian Unemployment Among Ages 60 to 64 years Correlation Chart
The statistical analysis conducted on geographies consisting of 226,488,675 people shows a poor positive correlation between the proportion of Immigrants from Spain and unemployment rate among population between the ages 60 and 64 in the United States with a correlation coefficient (R) of 0.185 and weighted average of 5.2%. Similarly, the statistical analysis conducted on geographies consisting of 395,725,516 people shows a moderate positive correlation between the proportion of Ukrainians and unemployment rate among population between the ages 60 and 64 in the United States with a correlation coefficient (R) of 0.480 and weighted average of 4.7%, a difference of 9.5%.
Unemployment Among Ages 60 to 64 years Correlation Summary
| Measurement | Immigrants from Spain | Ukrainian |
| Minimum | 1.6% | 3.1% |
| Maximum | 45.1% | 22.2% |
| Range | 43.5% | 19.1% |
| Mean | 9.2% | 6.2% |
| Median | 6.3% | 5.1% |
| Interquartile 25% (IQ1) | 4.7% | 4.6% |
| Interquartile 75% (IQ3) | 8.9% | 6.4% |
| Interquartile Range (IQR) | 4.2% | 1.8% |
| Standard Deviation (Sample) | 9.2% | 3.9% |
| Standard Deviation (Population) | 9.1% | 3.8% |
Similar Demographics by Unemployment Among Ages 60 to 64 years
Demographics Similar to Immigrants from Spain by Unemployment Among Ages 60 to 64 years
In terms of unemployment among ages 60 to 64 years, the demographic groups most similar to Immigrants from Spain are Haitian (5.2%, a difference of 0.070%), Israeli (5.2%, a difference of 0.10%), Hopi (5.2%, a difference of 0.14%), Immigrants from Hong Kong (5.2%, a difference of 0.28%), and Immigrants from Iran (5.1%, a difference of 0.37%).
| Demographics | Rating | Rank | Unemployment Among Ages 60 to 64 years |
| Immigrants | Australia | 0.2 /100 | #266 | Tragic 5.1% |
| Immigrants | Bahamas | 0.2 /100 | #267 | Tragic 5.1% |
| Central American Indians | 0.2 /100 | #268 | Tragic 5.1% |
| Immigrants | Costa Rica | 0.2 /100 | #269 | Tragic 5.1% |
| Immigrants | Iran | 0.1 /100 | #270 | Tragic 5.1% |
| Israelis | 0.1 /100 | #271 | Tragic 5.2% |
| Haitians | 0.1 /100 | #272 | Tragic 5.2% |
| Immigrants | Spain | 0.1 /100 | #273 | Tragic 5.2% |
| Hopi | 0.1 /100 | #274 | Tragic 5.2% |
| Immigrants | Hong Kong | 0.1 /100 | #275 | Tragic 5.2% |
| Central Americans | 0.0 /100 | #276 | Tragic 5.2% |
| Immigrants | Caribbean | 0.0 /100 | #277 | Tragic 5.2% |
| Guatemalans | 0.0 /100 | #278 | Tragic 5.2% |
| Nepalese | 0.0 /100 | #279 | Tragic 5.2% |
| French American Indians | 0.0 /100 | #280 | Tragic 5.2% |
Demographics Similar to Ukrainians by Unemployment Among Ages 60 to 64 years
In terms of unemployment among ages 60 to 64 years, the demographic groups most similar to Ukrainians are Immigrants from England (4.7%, a difference of 0.050%), Immigrants from Germany (4.7%, a difference of 0.050%), Immigrants from Romania (4.7%, a difference of 0.090%), Immigrants from Morocco (4.7%, a difference of 0.090%), and Macedonian (4.7%, a difference of 0.10%).
| Demographics | Rating | Rank | Unemployment Among Ages 60 to 64 years |
| French | 97.1 /100 | #111 | Exceptional 4.7% |
| Syrians | 97.0 /100 | #112 | Exceptional 4.7% |
| Bulgarians | 96.6 /100 | #113 | Exceptional 4.7% |
| Maltese | 96.5 /100 | #114 | Exceptional 4.7% |
| Immigrants | Romania | 96.4 /100 | #115 | Exceptional 4.7% |
| Immigrants | England | 96.3 /100 | #116 | Exceptional 4.7% |
| Immigrants | Germany | 96.3 /100 | #117 | Exceptional 4.7% |
| Ukrainians | 96.1 /100 | #118 | Exceptional 4.7% |
| Immigrants | Morocco | 95.7 /100 | #119 | Exceptional 4.7% |
| Macedonians | 95.7 /100 | #120 | Exceptional 4.7% |
| Albanians | 95.3 /100 | #121 | Exceptional 4.7% |
| Immigrants | Kazakhstan | 95.1 /100 | #122 | Exceptional 4.7% |
| Finns | 94.7 /100 | #123 | Exceptional 4.7% |
| Immigrants | Senegal | 94.5 /100 | #124 | Exceptional 4.7% |
| Immigrants | Thailand | 93.7 /100 | #125 | Exceptional 4.7% |