Immigrants from Spain vs Tongan Unemployment Among Ages 60 to 64 years

COMPARE

Immigrants from Spain
Race
Ancestry
AfghanAfricanAlaska NativeAlaskan AthabascanAlbanianAleutAlsatianAmericanApacheArabArapahoArgentineanArmenianAssyrian/Chaldean/SyriacAustralianAustrianBahamianBangladeshiBarbadianBasqueBelgianBelizeanBermudanBhutaneseBlackfeetBolivianBrazilianBritishBritish West IndianBulgarianBurmeseCajunCambodianCanadianCape VerdeanCarpatho RusynCelticCentral AmericanCentral American IndianCherokeeCheyenneChickasawChileanChineseChippewaChoctawColombianColvilleComancheCosta RicanCreeCreekCroatianCrowCubanCypriotCzechCzechoslovakianDanishDelawareDominicanDutchDutch West IndianEastern EuropeanEcuadorianEgyptianEnglishEstonianEthiopianEuropeanFijianFilipinoFinnishFrenchFrench American IndianFrench CanadianGermanGerman RussianGhanaianGreekGuamanian/ChamorroGuatemalanGuyaneseHaitianHmongHonduranHopiHoumaHungarianIcelanderIndian (Asian)IndonesianInupiatIranianIraqiIrishIroquoisIsraeliItalianJamaicanJapaneseJordanianKenyanKiowaKoreanLaotianLatvianLebaneseLiberianLithuanianLumbeeLuxembourgerMacedonianMalaysianMalteseMarshalleseMenomineeMexicanMexican American IndianMongolianMoroccanNative HawaiianNavajoNepaleseNew ZealanderNicaraguanNigerianNorthern EuropeanNorwegianOkinawanOsageOttawaPaiutePakistaniPalestinianPanamanianParaguayanPennsylvania GermanPeruvianPimaPolishPortuguesePotawatomiPuebloPuerto RicanPuget Sound SalishRomanianRussianSalvadoranSamoanScandinavianScotch-IrishScottishSeminoleSenegaleseSerbianShoshoneSierra LeoneanSiouxSlavicSlovakSloveneSomaliSouth AfricanSouth AmericanSouth American IndianSoviet UnionSpaniardSpanishSpanish AmericanSpanish American IndianSri LankanSubsaharan AfricanSudaneseSwedishSwissSyrianTaiwaneseThaiTlingit-HaidaTohono O'OdhamTrinidadian and TobagonianTsimshianTurkishU.S. Virgin IslanderUgandanUkrainianUruguayanUteVenezuelanVietnameseWelshWest IndianYakamaYaquiYugoslavianYumanYup'ikZimbabwean
Immigration
NonimmigrantsImmigrantsAfghanistanAfricaAlbaniaArgentinaArmeniaAsiaAustraliaAustriaBahamasBangladeshBarbadosBelarusBelgiumBelizeBoliviaBosnia and HerzegovinaBrazilBulgariaBurma/MyanmarCabo VerdeCambodiaCameroonCanadaCaribbeanCentral AmericaChileChinaColombiaCongoCosta RicaCroatiaCubaCzechoslovakiaDenmarkDominicaDominican RepublicEastern AfricaEastern AsiaEastern EuropeEcuadorEgyptEl SalvadorEnglandEritreaEthiopiaEuropeFijiFranceGermanyGhanaGreeceGrenadaGuatemalaGuyanaHaitiHondurasHong KongHungaryIndiaIndonesiaIranIraqIrelandIsraelItalyJamaicaJapanJordanKazakhstanKenyaKoreaKuwaitLaosLatin AmericaLatviaLebanonLiberiaLithuaniaMalaysiaMexicoMicronesiaMiddle AfricaMoldovaMoroccoNepalNetherlandsNicaraguaNigeriaNorth AmericaNorth MacedoniaNorthern AfricaNorthern EuropeNorwayOceaniaPakistanPanamaPeruPhilippinesPolandPortugalRomaniaRussiaSaudi ArabiaScotlandSenegalSerbiaSierra LeoneSingaporeSomaliaSouth AfricaSouth AmericaSouth Central AsiaSouth Eastern AsiaSouthern EuropeSpainSri LankaSt. Vincent and the GrenadinesSudanSwedenSwitzerlandSyriaTaiwanThailandTrinidad and TobagoTurkeyUgandaUkraineUruguayUzbekistanVenezuelaVietnamWest IndiesWestern AfricaWestern AsiaWestern EuropeYemenZaireZimbabweAzores
Tongan
Race
Ancestry
AfghanAfricanAlaska NativeAlaskan AthabascanAlbanianAleutAlsatianAmericanApacheArabArapahoArgentineanArmenianAssyrian/Chaldean/SyriacAustralianAustrianBahamianBangladeshiBarbadianBasqueBelgianBelizeanBermudanBhutaneseBlackfeetBolivianBrazilianBritishBritish West IndianBulgarianBurmeseCajunCambodianCanadianCape VerdeanCarpatho RusynCelticCentral AmericanCentral American IndianCherokeeCheyenneChickasawChileanChineseChippewaChoctawColombianColvilleComancheCosta RicanCreeCreekCroatianCrowCubanCypriotCzechCzechoslovakianDanishDelawareDominicanDutchDutch West IndianEastern EuropeanEcuadorianEgyptianEnglishEstonianEthiopianEuropeanFijianFilipinoFinnishFrenchFrench American IndianFrench CanadianGermanGerman RussianGhanaianGreekGuamanian/ChamorroGuatemalanGuyaneseHaitianHmongHonduranHopiHoumaHungarianIcelanderIndian (Asian)IndonesianInupiatIranianIraqiIrishIroquoisIsraeliItalianJamaicanJapaneseJordanianKenyanKiowaKoreanLaotianLatvianLebaneseLiberianLithuanianLumbeeLuxembourgerMacedonianMalaysianMalteseMarshalleseMenomineeMexicanMexican American IndianMongolianMoroccanNative HawaiianNavajoNepaleseNew ZealanderNicaraguanNigerianNorthern EuropeanNorwegianOkinawanOsageOttawaPaiutePakistaniPalestinianPanamanianParaguayanPennsylvania GermanPeruvianPimaPolishPortuguesePotawatomiPuebloPuerto RicanPuget Sound SalishRomanianRussianSalvadoranSamoanScandinavianScotch-IrishScottishSeminoleSenegaleseSerbianShoshoneSierra LeoneanSiouxSlavicSlovakSloveneSomaliSouth AfricanSouth AmericanSouth American IndianSoviet UnionSpaniardSpanishSpanish AmericanSpanish American IndianSri LankanSubsaharan AfricanSudaneseSwedishSwissSyrianTaiwaneseThaiTlingit-HaidaTohono O'OdhamTonganTrinidadian and TobagonianTsimshianTurkishU.S. Virgin IslanderUgandanUkrainianUruguayanUteVenezuelanVietnameseWelshWest IndianYakamaYaquiYugoslavianYumanYup'ikZimbabwean
Immigration
NonimmigrantsImmigrantsAfghanistanAfricaAlbaniaArgentinaArmeniaAsiaAustraliaAustriaBahamasBangladeshBarbadosBelarusBelgiumBelizeBoliviaBosnia and HerzegovinaBrazilBulgariaBurma/MyanmarCabo VerdeCambodiaCameroonCanadaCaribbeanCentral AmericaChileChinaColombiaCongoCosta RicaCroatiaCubaCzechoslovakiaDenmarkDominicaDominican RepublicEastern AfricaEastern AsiaEastern EuropeEcuadorEgyptEl SalvadorEnglandEritreaEthiopiaEuropeFijiFranceGermanyGhanaGreeceGrenadaGuatemalaGuyanaHaitiHondurasHong KongHungaryIndiaIndonesiaIranIraqIrelandIsraelItalyJamaicaJapanJordanKazakhstanKenyaKoreaKuwaitLaosLatin AmericaLatviaLebanonLiberiaLithuaniaMalaysiaMexicoMicronesiaMiddle AfricaMoldovaMoroccoNepalNetherlandsNicaraguaNigeriaNorth AmericaNorth MacedoniaNorthern AfricaNorthern EuropeNorwayOceaniaPakistanPanamaPeruPhilippinesPolandPortugalRomaniaRussiaSaudi ArabiaScotlandSenegalSerbiaSierra LeoneSingaporeSomaliaSouth AfricaSouth AmericaSouth Central AsiaSouth Eastern AsiaSouthern EuropeSri LankaSt. Vincent and the GrenadinesSudanSwedenSwitzerlandSyriaTaiwanThailandTrinidad and TobagoTurkeyUgandaUkraineUruguayUzbekistanVenezuelaVietnamWest IndiesWestern AfricaWestern AsiaWestern EuropeYemenZaireZimbabweAzores
Unemployment Among Ages 60 to 64 years
Income
Poverty
Unemployment
Labor Participation
Family Structure
Vehicle Availability
Education Level
Disability

Unemployment Among Ages 60 to 64 years Comparison

Immigrants from Spain

Tongans

Tragic
Exceptional
5.2%
UNEMPLOYMENT AMONG AGES 60 TO 64 YEARS
0.1/ 100
METRIC RATING
273rd/ 347
METRIC RANK
4.6%
UNEMPLOYMENT AMONG AGES 60 TO 64 YEARS
99.5/ 100
METRIC RATING
72nd/ 347
METRIC RANK

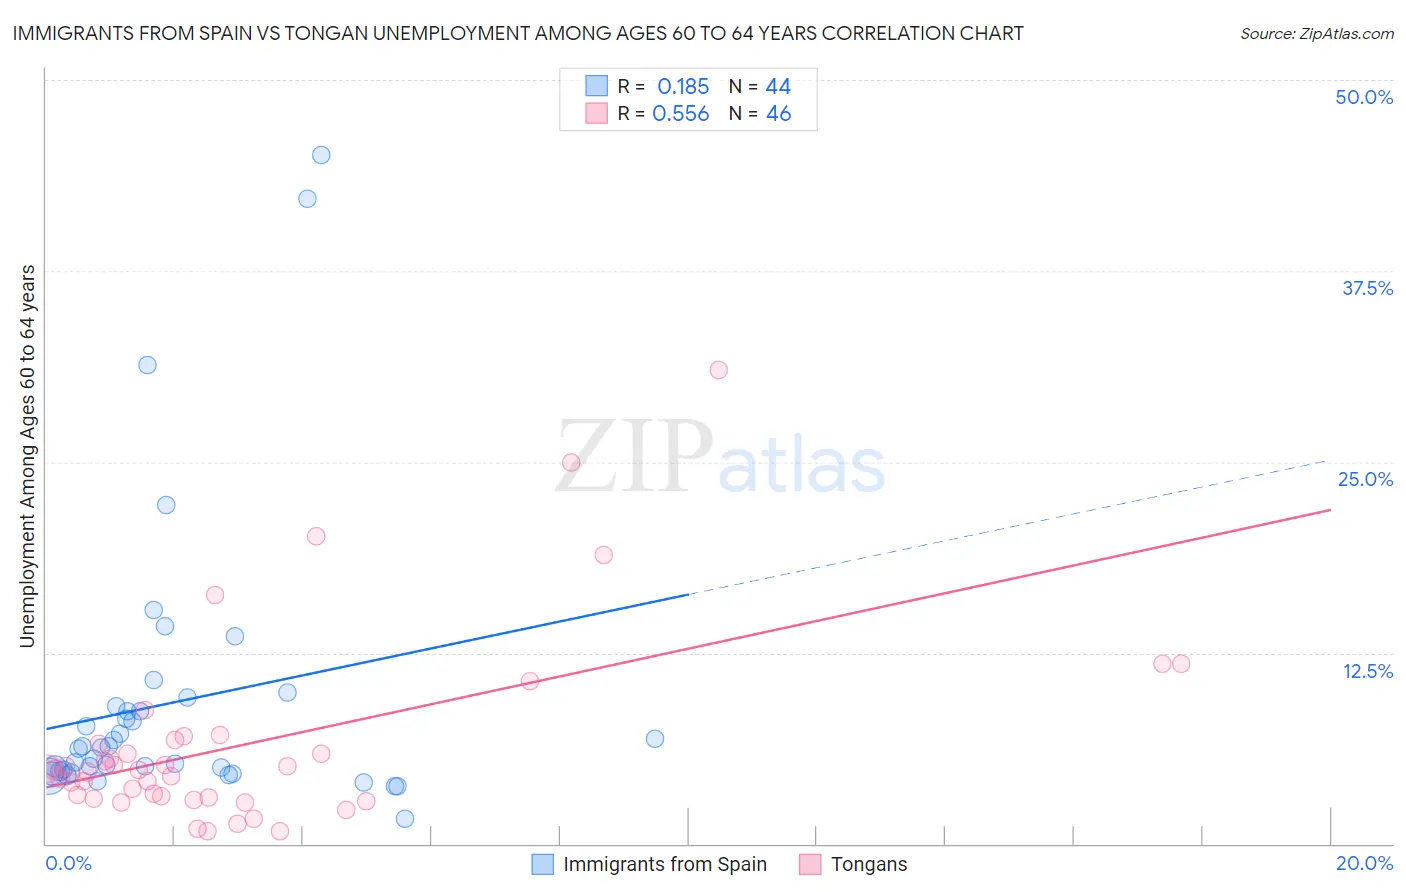
Immigrants from Spain vs Tongan Unemployment Among Ages 60 to 64 years Correlation Chart

The statistical analysis conducted on geographies consisting of 226,488,675 people shows a poor positive correlation between the proportion of Immigrants from Spain and unemployment rate among population between the ages 60 and 64 in the United States with a correlation coefficient (R) of 0.185 and weighted average of 5.2%. Similarly, the statistical analysis conducted on geographies consisting of 98,903,574 people shows a substantial positive correlation between the proportion of Tongans and unemployment rate among population between the ages 60 and 64 in the United States with a correlation coefficient (R) of 0.556 and weighted average of 4.6%, a difference of 11.6%.
Immigrants from Spain vs Tongan Unemployment Among Ages 60 to 64 years

Unemployment Among Ages 60 to 64 years Correlation Summary

MeasurementImmigrants from SpainTongan
Minimum1.6%0.80%
Maximum45.1%31.0%
Range43.5%30.2%
Mean9.2%6.6%
Median6.3%4.8%
Interquartile 25% (IQ1)4.7%3.0%
Interquartile 75% (IQ3)8.9%6.8%
Interquartile Range (IQR)4.2%3.8%
Standard Deviation (Sample)9.2%6.3%
Standard Deviation (Population)9.1%6.2%

Similar Demographics by Unemployment Among Ages 60 to 64 years

Demographics Similar to Immigrants from Spain by Unemployment Among Ages 60 to 64 years

In terms of unemployment among ages 60 to 64 years, the demographic groups most similar to Immigrants from Spain are Haitian (5.2%, a difference of 0.070%), Israeli (5.2%, a difference of 0.10%), Hopi (5.2%, a difference of 0.14%), Immigrants from Hong Kong (5.2%, a difference of 0.28%), and Immigrants from Iran (5.1%, a difference of 0.37%).
DemographicsRating | RankUnemployment Among Ages 60 to 64 years
Immigrants | Australia
0.2
/100
|
#266
Tragic
5.1%
Immigrants | Bahamas
0.2
/100
|
#267
Tragic
5.1%
Central American Indians
0.2
/100
|
#268
Tragic
5.1%
Immigrants | Costa Rica
0.2
/100
|
#269
Tragic
5.1%
Immigrants | Iran
0.1
/100
|
#270
Tragic
5.1%
Israelis
0.1
/100
|
#271
Tragic
5.2%
Haitians
0.1
/100
|
#272
Tragic
5.2%
Immigrants | Spain
0.1
/100
|
#273
Tragic
5.2%
Hopi
0.1
/100
|
#274
Tragic
5.2%
Immigrants | Hong Kong
0.1
/100
|
#275
Tragic
5.2%
Central Americans
0.0
/100
|
#276
Tragic
5.2%
Immigrants | Caribbean
0.0
/100
|
#277
Tragic
5.2%
Guatemalans
0.0
/100
|
#278
Tragic
5.2%
Nepalese
0.0
/100
|
#279
Tragic
5.2%
French American Indians
0.0
/100
|
#280
Tragic
5.2%

Demographics Similar to Tongans by Unemployment Among Ages 60 to 64 years

In terms of unemployment among ages 60 to 64 years, the demographic groups most similar to Tongans are Slavic (4.6%, a difference of 0.010%), Immigrants from Eastern Africa (4.6%, a difference of 0.020%), Croatian (4.6%, a difference of 0.090%), Creek (4.6%, a difference of 0.17%), and Northern European (4.6%, a difference of 0.20%).
DemographicsRating | RankUnemployment Among Ages 60 to 64 years
Jordanians
99.7
/100
|
#65
Exceptional
4.6%
Hawaiians
99.6
/100
|
#66
Exceptional
4.6%
Immigrants | Scotland
99.6
/100
|
#67
Exceptional
4.6%
Immigrants | Laos
99.6
/100
|
#68
Exceptional
4.6%
Creek
99.6
/100
|
#69
Exceptional
4.6%
Croatians
99.5
/100
|
#70
Exceptional
4.6%
Slavs
99.5
/100
|
#71
Exceptional
4.6%
Tongans
99.5
/100
|
#72
Exceptional
4.6%
Immigrants | Eastern Africa
99.5
/100
|
#73
Exceptional
4.6%
Northern Europeans
99.3
/100
|
#74
Exceptional
4.6%
Potawatomi
99.3
/100
|
#75
Exceptional
4.6%
Slovaks
99.3
/100
|
#76
Exceptional
4.6%
Immigrants | Somalia
99.2
/100
|
#77
Exceptional
4.6%
Seminole
99.2
/100
|
#78
Exceptional
4.7%
Irish
99.2
/100
|
#79
Exceptional
4.7%