Immigrants from Spain vs Mongolian Unemployment Among Women with Children Ages 6 to 17 years
COMPARE
Immigrants from Spain
Mongolian
Unemployment Among Women with Children Ages 6 to 17 years
Unemployment Among Women with Children Ages 6 to 17 years Comparison
Immigrants from Spain
Mongolians
9.0%
UNEMPLOYMENT AMONG WOMEN WITH CHILDREN AGES 6 TO 17 YEARS
32.4/ 100
METRIC RATING
186th/ 347
METRIC RANK
8.4%
UNEMPLOYMENT AMONG WOMEN WITH CHILDREN AGES 6 TO 17 YEARS
99.6/ 100
METRIC RATING
79th/ 347
METRIC RANK
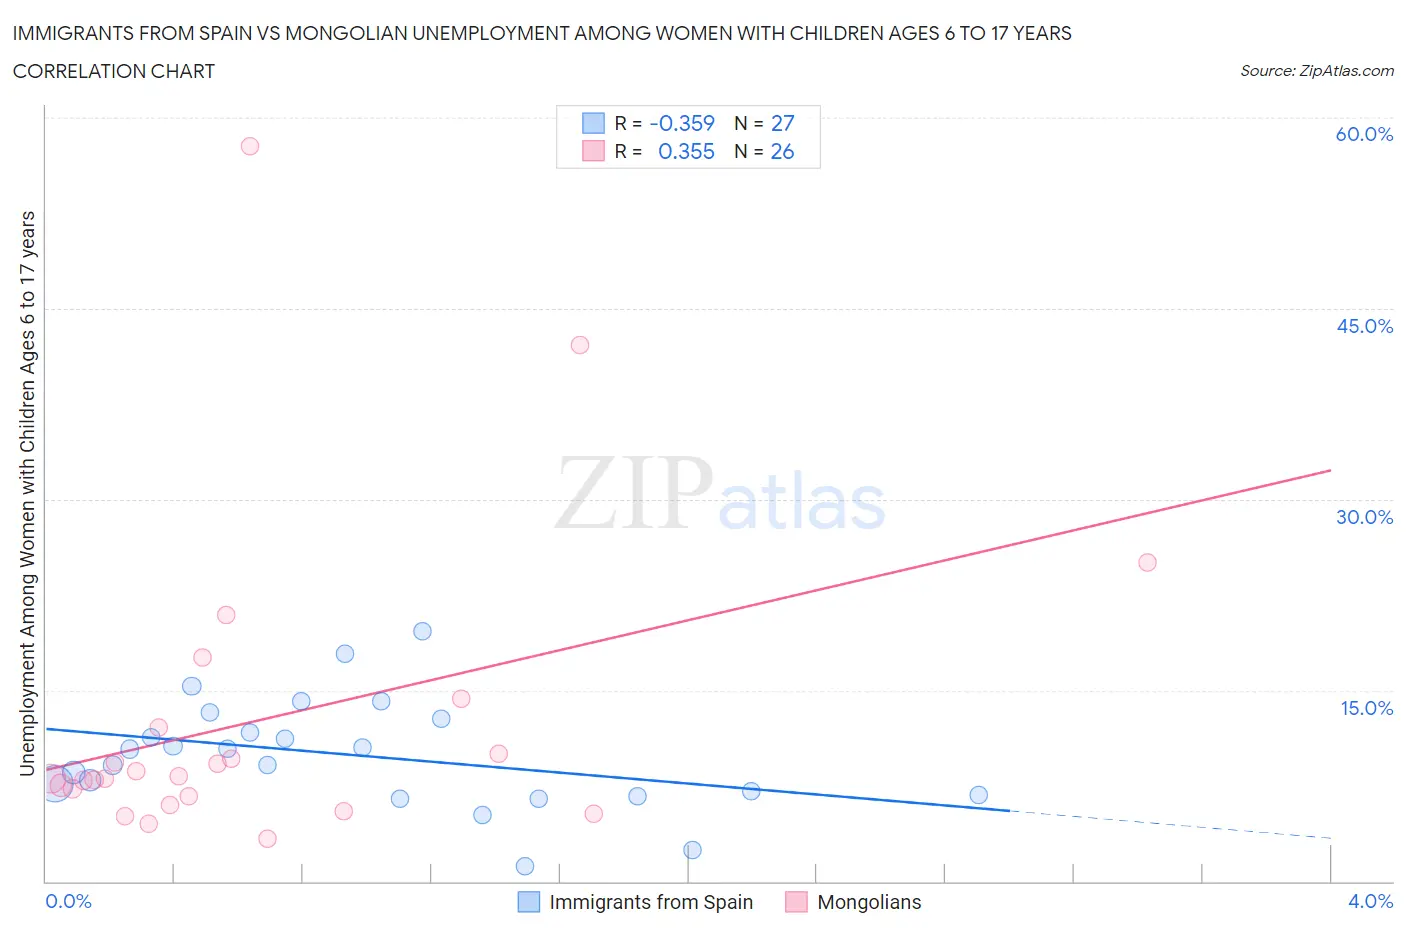
Immigrants from Spain vs Mongolian Unemployment Among Women with Children Ages 6 to 17 years Correlation Chart
The statistical analysis conducted on geographies consisting of 188,421,772 people shows a mild negative correlation between the proportion of Immigrants from Spain and unemployment rate among women with children between the ages 6 and 17 in the United States with a correlation coefficient (R) of -0.359 and weighted average of 9.0%. Similarly, the statistical analysis conducted on geographies consisting of 119,478,347 people shows a mild positive correlation between the proportion of Mongolians and unemployment rate among women with children between the ages 6 and 17 in the United States with a correlation coefficient (R) of 0.355 and weighted average of 8.4%, a difference of 7.5%.
Unemployment Among Women with Children Ages 6 to 17 years Correlation Summary
| Measurement | Immigrants from Spain | Mongolian |
| Minimum | 1.2% | 3.4% |
| Maximum | 19.7% | 57.7% |
| Range | 18.5% | 54.3% |
| Mean | 9.9% | 12.6% |
| Median | 10.4% | 8.2% |
| Interquartile 25% (IQ1) | 6.8% | 6.7% |
| Interquartile 75% (IQ3) | 12.7% | 12.1% |
| Interquartile Range (IQR) | 5.9% | 5.5% |
| Standard Deviation (Sample) | 4.2% | 12.3% |
| Standard Deviation (Population) | 4.2% | 12.0% |
Similar Demographics by Unemployment Among Women with Children Ages 6 to 17 years
Demographics Similar to Immigrants from Spain by Unemployment Among Women with Children Ages 6 to 17 years
In terms of unemployment among women with children ages 6 to 17 years, the demographic groups most similar to Immigrants from Spain are Immigrants from Congo (9.0%, a difference of 0.010%), Swiss (9.0%, a difference of 0.050%), Palestinian (9.0%, a difference of 0.050%), Immigrants from Czechoslovakia (9.0%, a difference of 0.10%), and South American Indian (9.0%, a difference of 0.10%).
| Demographics | Rating | Rank | Unemployment Among Women with Children Ages 6 to 17 years |
| Immigrants | Zaire | 38.3 /100 | #179 | Fair 9.0% |
| Ethiopians | 37.6 /100 | #180 | Fair 9.0% |
| Immigrants | Czechoslovakia | 34.5 /100 | #181 | Fair 9.0% |
| South American Indians | 34.4 /100 | #182 | Fair 9.0% |
| Swiss | 33.5 /100 | #183 | Fair 9.0% |
| Palestinians | 33.4 /100 | #184 | Fair 9.0% |
| Immigrants | Congo | 32.5 /100 | #185 | Fair 9.0% |
| Immigrants | Spain | 32.4 /100 | #186 | Fair 9.0% |
| Comanche | 30.0 /100 | #187 | Fair 9.0% |
| Immigrants | Syria | 29.7 /100 | #188 | Fair 9.1% |
| Immigrants | Immigrants | 29.2 /100 | #189 | Fair 9.1% |
| Slovenes | 28.5 /100 | #190 | Fair 9.1% |
| Belizeans | 28.4 /100 | #191 | Fair 9.1% |
| Guamanians/Chamorros | 27.2 /100 | #192 | Fair 9.1% |
| Immigrants | Turkey | 25.8 /100 | #193 | Fair 9.1% |
Demographics Similar to Mongolians by Unemployment Among Women with Children Ages 6 to 17 years
In terms of unemployment among women with children ages 6 to 17 years, the demographic groups most similar to Mongolians are Pakistani (8.4%, a difference of 0.010%), Immigrants from Belarus (8.4%, a difference of 0.040%), Iraqi (8.4%, a difference of 0.15%), Immigrants from Bolivia (8.4%, a difference of 0.16%), and Cypriot (8.4%, a difference of 0.18%).
| Demographics | Rating | Rank | Unemployment Among Women with Children Ages 6 to 17 years |
| Immigrants | Nepal | 99.8 /100 | #72 | Exceptional 8.3% |
| Spanish Americans | 99.8 /100 | #73 | Exceptional 8.4% |
| Samoans | 99.7 /100 | #74 | Exceptional 8.4% |
| Immigrants | Sri Lanka | 99.7 /100 | #75 | Exceptional 8.4% |
| Immigrants | Moldova | 99.7 /100 | #76 | Exceptional 8.4% |
| Iraqis | 99.7 /100 | #77 | Exceptional 8.4% |
| Pakistanis | 99.6 /100 | #78 | Exceptional 8.4% |
| Mongolians | 99.6 /100 | #79 | Exceptional 8.4% |
| Immigrants | Belarus | 99.6 /100 | #80 | Exceptional 8.4% |
| Immigrants | Bolivia | 99.6 /100 | #81 | Exceptional 8.4% |
| Cypriots | 99.6 /100 | #82 | Exceptional 8.4% |
| Bulgarians | 99.5 /100 | #83 | Exceptional 8.4% |
| Japanese | 99.5 /100 | #84 | Exceptional 8.4% |
| Immigrants | North Macedonia | 99.4 /100 | #85 | Exceptional 8.5% |
| Alaskan Athabascans | 99.4 /100 | #86 | Exceptional 8.5% |