Immigrants from South Eastern Asia vs Thai Unemployment Among Ages 65 to 74 years
COMPARE
Immigrants from South Eastern Asia
Thai
Unemployment Among Ages 65 to 74 years
Unemployment Among Ages 65 to 74 years Comparison
Immigrants from South Eastern Asia
Thais
5.3%
UNEMPLOYMENT AMONG AGES 65 TO 74 YEARS
87.2/ 100
METRIC RATING
126th/ 347
METRIC RANK
5.2%
UNEMPLOYMENT AMONG AGES 65 TO 74 YEARS
98.6/ 100
METRIC RATING
82nd/ 347
METRIC RANK
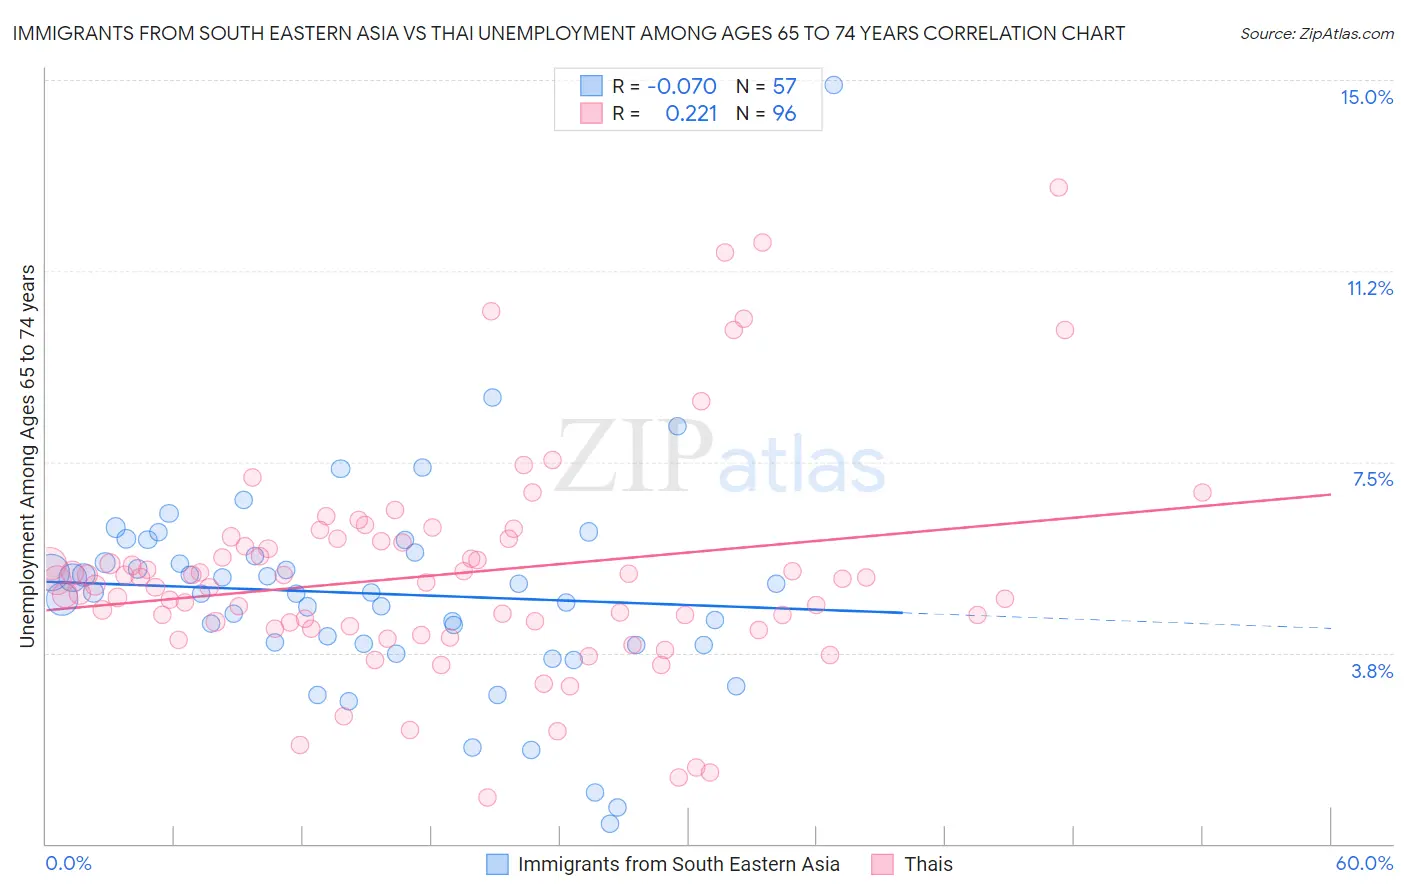
Immigrants from South Eastern Asia vs Thai Unemployment Among Ages 65 to 74 years Correlation Chart
The statistical analysis conducted on geographies consisting of 425,067,321 people shows a slight negative correlation between the proportion of Immigrants from South Eastern Asia and unemployment rate among population between the ages 65 and 74 in the United States with a correlation coefficient (R) of -0.070 and weighted average of 5.3%. Similarly, the statistical analysis conducted on geographies consisting of 406,164,578 people shows a weak positive correlation between the proportion of Thais and unemployment rate among population between the ages 65 and 74 in the United States with a correlation coefficient (R) of 0.221 and weighted average of 5.2%, a difference of 2.0%.
Unemployment Among Ages 65 to 74 years Correlation Summary
| Measurement | Immigrants from South Eastern Asia | Thai |
| Minimum | 0.40% | 0.90% |
| Maximum | 14.9% | 12.9% |
| Range | 14.5% | 12.0% |
| Mean | 4.9% | 5.3% |
| Median | 4.9% | 5.2% |
| Interquartile 25% (IQ1) | 3.9% | 4.2% |
| Interquartile 75% (IQ3) | 5.7% | 5.9% |
| Interquartile Range (IQR) | 1.8% | 1.7% |
| Standard Deviation (Sample) | 2.1% | 2.1% |
| Standard Deviation (Population) | 2.1% | 2.1% |
Similar Demographics by Unemployment Among Ages 65 to 74 years
Demographics Similar to Immigrants from South Eastern Asia by Unemployment Among Ages 65 to 74 years
In terms of unemployment among ages 65 to 74 years, the demographic groups most similar to Immigrants from South Eastern Asia are Pakistani (5.3%, a difference of 0.020%), Immigrants from Ukraine (5.3%, a difference of 0.030%), Immigrants from North America (5.3%, a difference of 0.040%), Immigrants from Hong Kong (5.3%, a difference of 0.050%), and Immigrants from England (5.3%, a difference of 0.070%).
| Demographics | Rating | Rank | Unemployment Among Ages 65 to 74 years |
| Immigrants | Fiji | 89.9 /100 | #119 | Excellent 5.3% |
| Immigrants | Switzerland | 89.9 /100 | #120 | Excellent 5.3% |
| Immigrants | Australia | 89.1 /100 | #121 | Excellent 5.3% |
| Immigrants | Canada | 89.0 /100 | #122 | Excellent 5.3% |
| Czechoslovakians | 88.6 /100 | #123 | Excellent 5.3% |
| Immigrants | Ukraine | 87.5 /100 | #124 | Excellent 5.3% |
| Pakistanis | 87.5 /100 | #125 | Excellent 5.3% |
| Immigrants | South Eastern Asia | 87.2 /100 | #126 | Excellent 5.3% |
| Immigrants | North America | 86.7 /100 | #127 | Excellent 5.3% |
| Immigrants | Hong Kong | 86.5 /100 | #128 | Excellent 5.3% |
| Immigrants | England | 86.2 /100 | #129 | Excellent 5.3% |
| Eastern Europeans | 85.6 /100 | #130 | Excellent 5.3% |
| Immigrants | Russia | 83.0 /100 | #131 | Excellent 5.3% |
| Koreans | 82.6 /100 | #132 | Excellent 5.3% |
| Ukrainians | 82.0 /100 | #133 | Excellent 5.3% |
Demographics Similar to Thais by Unemployment Among Ages 65 to 74 years
In terms of unemployment among ages 65 to 74 years, the demographic groups most similar to Thais are Immigrants from Scotland (5.2%, a difference of 0.0%), Immigrants from South Africa (5.2%, a difference of 0.020%), Slavic (5.2%, a difference of 0.030%), Immigrants from Middle Africa (5.2%, a difference of 0.15%), and Northern European (5.2%, a difference of 0.22%).
| Demographics | Rating | Rank | Unemployment Among Ages 65 to 74 years |
| Okinawans | 99.0 /100 | #75 | Exceptional 5.2% |
| Estonians | 99.0 /100 | #76 | Exceptional 5.2% |
| Immigrants | Sudan | 98.9 /100 | #77 | Exceptional 5.2% |
| Northern Europeans | 98.9 /100 | #78 | Exceptional 5.2% |
| Slavs | 98.7 /100 | #79 | Exceptional 5.2% |
| Immigrants | South Africa | 98.6 /100 | #80 | Exceptional 5.2% |
| Immigrants | Scotland | 98.6 /100 | #81 | Exceptional 5.2% |
| Thais | 98.6 /100 | #82 | Exceptional 5.2% |
| Immigrants | Middle Africa | 98.4 /100 | #83 | Exceptional 5.2% |
| Immigrants | Hungary | 98.0 /100 | #84 | Exceptional 5.2% |
| British | 97.9 /100 | #85 | Exceptional 5.2% |
| Danes | 97.9 /100 | #86 | Exceptional 5.2% |
| Scottish | 97.9 /100 | #87 | Exceptional 5.2% |
| Immigrants | Saudi Arabia | 97.9 /100 | #88 | Exceptional 5.2% |
| English | 97.8 /100 | #89 | Exceptional 5.2% |