Immigrants from Lithuania vs Thai Unemployment Among Ages 65 to 74 years
COMPARE
Immigrants from Lithuania
Thai
Unemployment Among Ages 65 to 74 years
Unemployment Among Ages 65 to 74 years Comparison
Immigrants from Lithuania
Thais
5.2%
UNEMPLOYMENT AMONG AGES 65 TO 74 YEARS
95.9/ 100
METRIC RATING
102nd/ 347
METRIC RANK
5.2%
UNEMPLOYMENT AMONG AGES 65 TO 74 YEARS
98.6/ 100
METRIC RATING
82nd/ 347
METRIC RANK
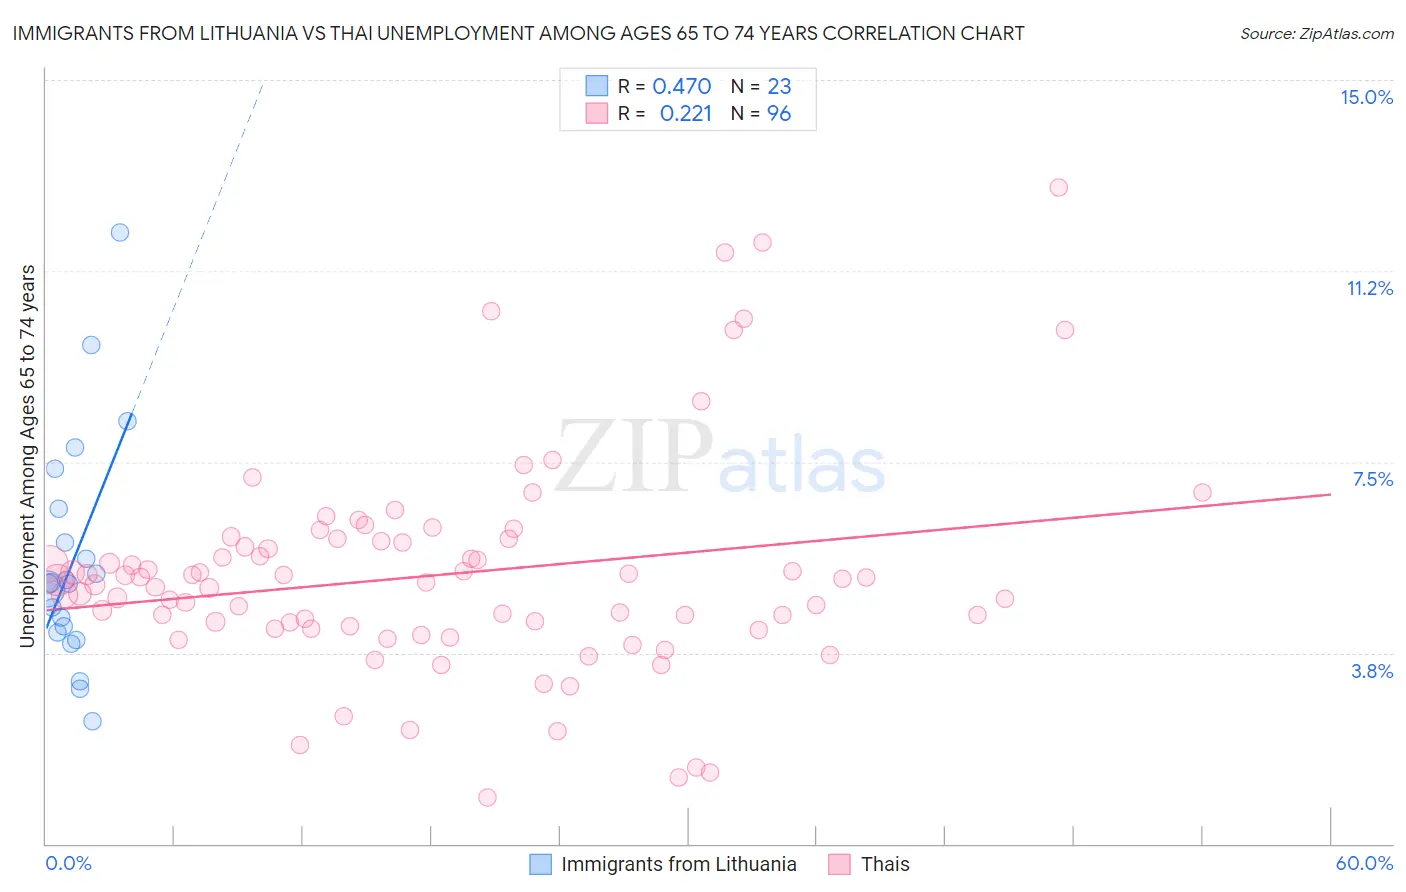
Immigrants from Lithuania vs Thai Unemployment Among Ages 65 to 74 years Correlation Chart
The statistical analysis conducted on geographies consisting of 112,270,801 people shows a moderate positive correlation between the proportion of Immigrants from Lithuania and unemployment rate among population between the ages 65 and 74 in the United States with a correlation coefficient (R) of 0.470 and weighted average of 5.2%. Similarly, the statistical analysis conducted on geographies consisting of 406,164,578 people shows a weak positive correlation between the proportion of Thais and unemployment rate among population between the ages 65 and 74 in the United States with a correlation coefficient (R) of 0.221 and weighted average of 5.2%, a difference of 0.96%.
Unemployment Among Ages 65 to 74 years Correlation Summary
| Measurement | Immigrants from Lithuania | Thai |
| Minimum | 2.4% | 0.90% |
| Maximum | 12.0% | 12.9% |
| Range | 9.6% | 12.0% |
| Mean | 5.6% | 5.3% |
| Median | 5.1% | 5.2% |
| Interquartile 25% (IQ1) | 4.2% | 4.2% |
| Interquartile 75% (IQ3) | 6.6% | 5.9% |
| Interquartile Range (IQR) | 2.4% | 1.7% |
| Standard Deviation (Sample) | 2.2% | 2.1% |
| Standard Deviation (Population) | 2.2% | 2.1% |
Demographics Similar to Immigrants from Lithuania and Thais by Unemployment Among Ages 65 to 74 years
In terms of unemployment among ages 65 to 74 years, the demographic groups most similar to Immigrants from Lithuania are Japanese (5.2%, a difference of 0.10%), Immigrants from Cambodia (5.2%, a difference of 0.10%), Burmese (5.2%, a difference of 0.12%), Senegalese (5.2%, a difference of 0.14%), and Welsh (5.2%, a difference of 0.14%). Similarly, the demographic groups most similar to Thais are Immigrants from Middle Africa (5.2%, a difference of 0.15%), Immigrants from Hungary (5.2%, a difference of 0.33%), British (5.2%, a difference of 0.36%), Danish (5.2%, a difference of 0.37%), and Scottish (5.2%, a difference of 0.37%).
| Demographics | Rating | Rank | Unemployment Among Ages 65 to 74 years |
| Thais | 98.6 /100 | #82 | Exceptional 5.2% |
| Immigrants | Middle Africa | 98.4 /100 | #83 | Exceptional 5.2% |
| Immigrants | Hungary | 98.0 /100 | #84 | Exceptional 5.2% |
| British | 97.9 /100 | #85 | Exceptional 5.2% |
| Danes | 97.9 /100 | #86 | Exceptional 5.2% |
| Scottish | 97.9 /100 | #87 | Exceptional 5.2% |
| Immigrants | Saudi Arabia | 97.9 /100 | #88 | Exceptional 5.2% |
| English | 97.8 /100 | #89 | Exceptional 5.2% |
| Luxembourgers | 97.6 /100 | #90 | Exceptional 5.2% |
| Romanians | 97.4 /100 | #91 | Exceptional 5.2% |
| Puget Sound Salish | 97.3 /100 | #92 | Exceptional 5.2% |
| Immigrants | Netherlands | 97.1 /100 | #93 | Exceptional 5.2% |
| South Africans | 97.1 /100 | #94 | Exceptional 5.2% |
| Serbians | 97.0 /100 | #95 | Exceptional 5.2% |
| Immigrants | Thailand | 97.0 /100 | #96 | Exceptional 5.2% |
| Senegalese | 96.5 /100 | #97 | Exceptional 5.2% |
| Welsh | 96.5 /100 | #98 | Exceptional 5.2% |
| Burmese | 96.4 /100 | #99 | Exceptional 5.2% |
| Japanese | 96.4 /100 | #100 | Exceptional 5.2% |
| Immigrants | Cambodia | 96.3 /100 | #101 | Exceptional 5.2% |
| Immigrants | Lithuania | 95.9 /100 | #102 | Exceptional 5.2% |