Immigrants from South America vs Thai Female Unemployment
COMPARE
Immigrants from South America
Thai
Female Unemployment
Female Unemployment Comparison
Immigrants from South America
Thais
5.5%
FEMALE UNEMPLOYMENT
2.9/ 100
METRIC RATING
240th/ 347
METRIC RANK
4.9%
FEMALE UNEMPLOYMENT
99.2/ 100
METRIC RATING
48th/ 347
METRIC RANK
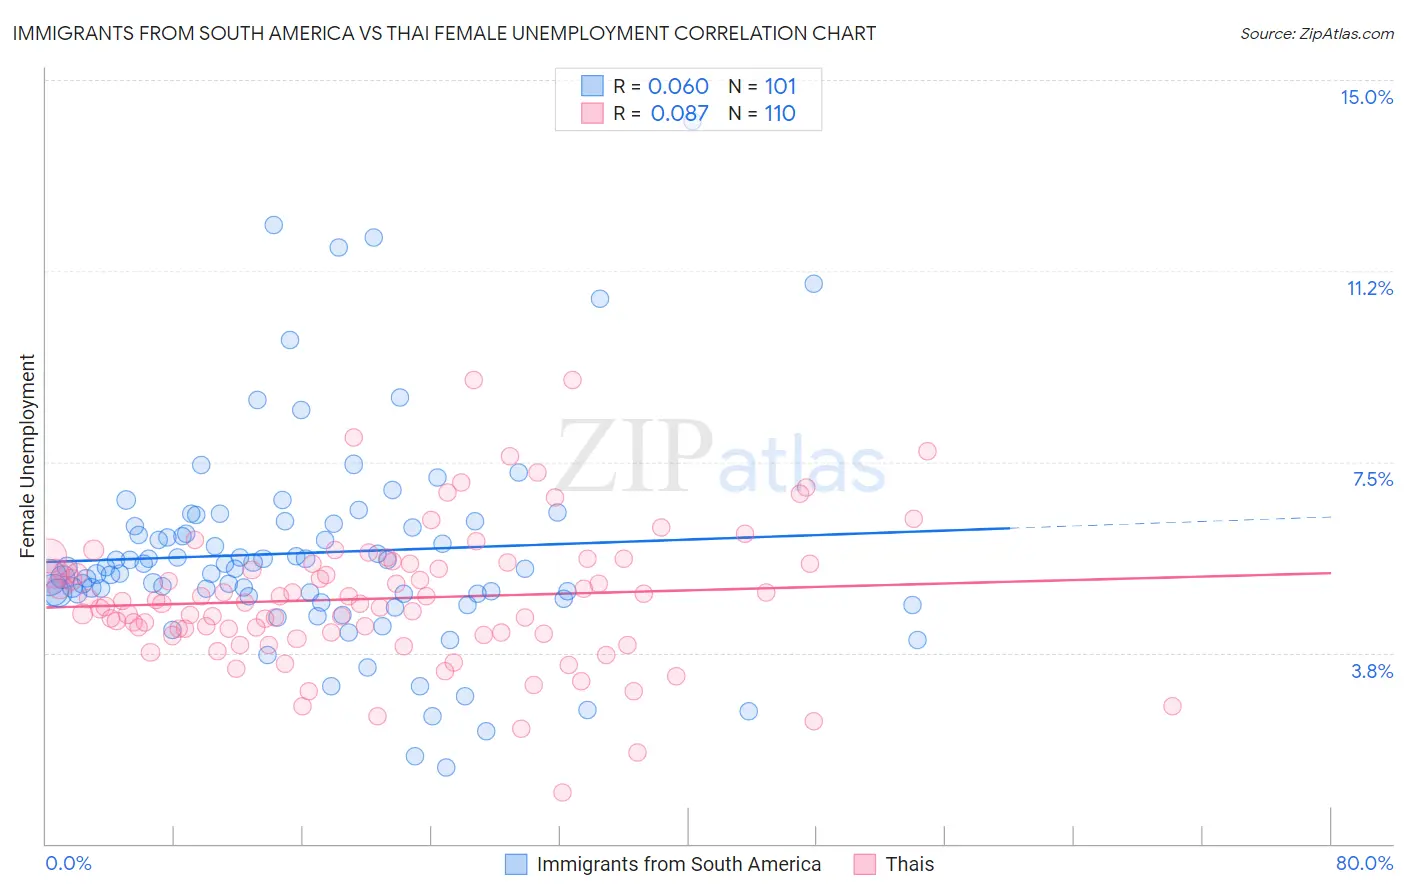
Immigrants from South America vs Thai Female Unemployment Correlation Chart
The statistical analysis conducted on geographies consisting of 482,537,593 people shows a slight positive correlation between the proportion of Immigrants from South America and unemploymnet rate among females in the United States with a correlation coefficient (R) of 0.060 and weighted average of 5.5%. Similarly, the statistical analysis conducted on geographies consisting of 472,800,802 people shows a slight positive correlation between the proportion of Thais and unemploymnet rate among females in the United States with a correlation coefficient (R) of 0.087 and weighted average of 4.9%, a difference of 13.5%.
Female Unemployment Correlation Summary
| Measurement | Immigrants from South America | Thai |
| Minimum | 1.5% | 1.0% |
| Maximum | 14.2% | 9.1% |
| Range | 12.7% | 8.1% |
| Mean | 5.7% | 4.8% |
| Median | 5.4% | 4.7% |
| Interquartile 25% (IQ1) | 4.9% | 4.1% |
| Interquartile 75% (IQ3) | 6.3% | 5.5% |
| Interquartile Range (IQR) | 1.4% | 1.4% |
| Standard Deviation (Sample) | 2.1% | 1.4% |
| Standard Deviation (Population) | 2.1% | 1.3% |
Similar Demographics by Female Unemployment
Demographics Similar to Immigrants from South America by Female Unemployment
In terms of female unemployment, the demographic groups most similar to Immigrants from South America are Aleut (5.5%, a difference of 0.040%), South American Indian (5.5%, a difference of 0.050%), Sierra Leonean (5.5%, a difference of 0.14%), Immigrants from Panama (5.5%, a difference of 0.16%), and Immigrants from Cambodia (5.5%, a difference of 0.18%).
| Demographics | Rating | Rank | Female Unemployment |
| Moroccans | 3.4 /100 | #233 | Tragic 5.5% |
| Immigrants | Lebanon | 3.3 /100 | #234 | Tragic 5.5% |
| Immigrants | Iran | 3.3 /100 | #235 | Tragic 5.5% |
| Immigrants | Cambodia | 3.3 /100 | #236 | Tragic 5.5% |
| Immigrants | Panama | 3.2 /100 | #237 | Tragic 5.5% |
| Sierra Leoneans | 3.2 /100 | #238 | Tragic 5.5% |
| Aleuts | 3.0 /100 | #239 | Tragic 5.5% |
| Immigrants | South America | 2.9 /100 | #240 | Tragic 5.5% |
| South American Indians | 2.8 /100 | #241 | Tragic 5.5% |
| Marshallese | 2.3 /100 | #242 | Tragic 5.6% |
| Spanish Americans | 2.2 /100 | #243 | Tragic 5.6% |
| Immigrants | Liberia | 1.5 /100 | #244 | Tragic 5.6% |
| Guamanians/Chamorros | 1.4 /100 | #245 | Tragic 5.6% |
| Japanese | 1.2 /100 | #246 | Tragic 5.6% |
| Immigrants | Western Asia | 1.1 /100 | #247 | Tragic 5.6% |
Demographics Similar to Thais by Female Unemployment
In terms of female unemployment, the demographic groups most similar to Thais are Australian (4.9%, a difference of 0.0%), Okinawan (4.9%, a difference of 0.21%), Immigrants from Cuba (4.9%, a difference of 0.24%), Cambodian (4.9%, a difference of 0.26%), and Slavic (4.9%, a difference of 0.28%).
| Demographics | Rating | Rank | Female Unemployment |
| Tongans | 99.5 /100 | #41 | Exceptional 4.8% |
| Italians | 99.5 /100 | #42 | Exceptional 4.8% |
| Eastern Europeans | 99.4 /100 | #43 | Exceptional 4.9% |
| Greeks | 99.4 /100 | #44 | Exceptional 4.9% |
| Austrians | 99.3 /100 | #45 | Exceptional 4.9% |
| Immigrants | Bulgaria | 99.3 /100 | #46 | Exceptional 4.9% |
| Okinawans | 99.3 /100 | #47 | Exceptional 4.9% |
| Thais | 99.2 /100 | #48 | Exceptional 4.9% |
| Australians | 99.2 /100 | #49 | Exceptional 4.9% |
| Immigrants | Cuba | 99.1 /100 | #50 | Exceptional 4.9% |
| Cambodians | 99.1 /100 | #51 | Exceptional 4.9% |
| Slavs | 99.1 /100 | #52 | Exceptional 4.9% |
| Whites/Caucasians | 99.0 /100 | #53 | Exceptional 4.9% |
| Immigrants | Zimbabwe | 99.0 /100 | #54 | Exceptional 4.9% |
| Immigrants | Moldova | 99.0 /100 | #55 | Exceptional 4.9% |