Immigrants from South America vs Immigrants from Peru Unemployment Among Ages 30 to 34 years
COMPARE
Immigrants from South America
Immigrants from Peru
Unemployment Among Ages 30 to 34 years
Unemployment Among Ages 30 to 34 years Comparison
Immigrants from South America
Immigrants from Peru
5.5%
UNEMPLOYMENT AMONG AGES 30 TO 34 YEARS
29.8/ 100
METRIC RATING
196th/ 347
METRIC RANK
5.5%
UNEMPLOYMENT AMONG AGES 30 TO 34 YEARS
48.0/ 100
METRIC RATING
176th/ 347
METRIC RANK
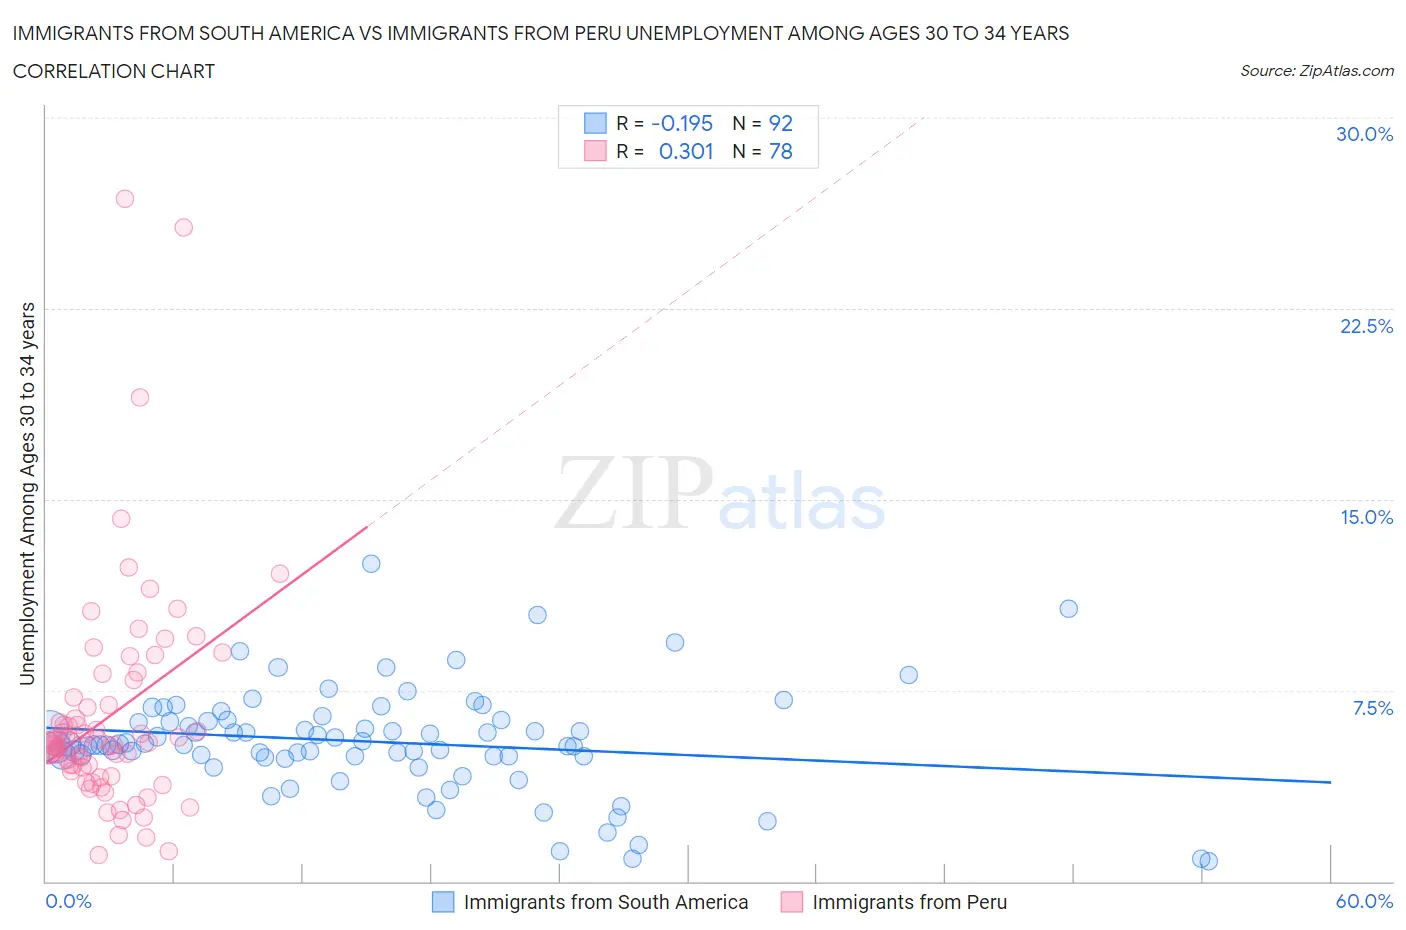
Immigrants from South America vs Immigrants from Peru Unemployment Among Ages 30 to 34 years Correlation Chart
The statistical analysis conducted on geographies consisting of 448,094,916 people shows a poor negative correlation between the proportion of Immigrants from South America and unemployment rate among population between the ages 30 and 34 in the United States with a correlation coefficient (R) of -0.195 and weighted average of 5.5%. Similarly, the statistical analysis conducted on geographies consisting of 315,910,797 people shows a mild positive correlation between the proportion of Immigrants from Peru and unemployment rate among population between the ages 30 and 34 in the United States with a correlation coefficient (R) of 0.301 and weighted average of 5.5%, a difference of 1.3%.
Unemployment Among Ages 30 to 34 years Correlation Summary
| Measurement | Immigrants from South America | Immigrants from Peru |
| Minimum | 0.80% | 1.1% |
| Maximum | 12.5% | 26.8% |
| Range | 11.7% | 25.7% |
| Mean | 5.5% | 6.5% |
| Median | 5.4% | 5.4% |
| Interquartile 25% (IQ1) | 4.9% | 4.3% |
| Interquartile 75% (IQ3) | 6.3% | 7.2% |
| Interquartile Range (IQR) | 1.4% | 2.9% |
| Standard Deviation (Sample) | 2.0% | 4.4% |
| Standard Deviation (Population) | 2.0% | 4.4% |
Demographics Similar to Immigrants from South America and Immigrants from Peru by Unemployment Among Ages 30 to 34 years
In terms of unemployment among ages 30 to 34 years, the demographic groups most similar to Immigrants from South America are Finnish (5.5%, a difference of 0.070%), Slavic (5.5%, a difference of 0.090%), Immigrants from Africa (5.5%, a difference of 0.10%), Irish (5.5%, a difference of 0.12%), and Moroccan (5.5%, a difference of 0.12%). Similarly, the demographic groups most similar to Immigrants from Peru are Immigrants from Ukraine (5.5%, a difference of 0.020%), Macedonian (5.5%, a difference of 0.070%), Costa Rican (5.5%, a difference of 0.090%), Italian (5.5%, a difference of 0.18%), and Immigrants from Lebanon (5.5%, a difference of 0.32%).
| Demographics | Rating | Rank | Unemployment Among Ages 30 to 34 years |
| Immigrants | Peru | 48.0 /100 | #176 | Average 5.5% |
| Immigrants | Ukraine | 47.7 /100 | #177 | Average 5.5% |
| Macedonians | 47.1 /100 | #178 | Average 5.5% |
| Costa Ricans | 46.7 /100 | #179 | Average 5.5% |
| Italians | 45.5 /100 | #180 | Average 5.5% |
| Immigrants | Lebanon | 43.5 /100 | #181 | Average 5.5% |
| Immigrants | Denmark | 43.4 /100 | #182 | Average 5.5% |
| Hungarians | 43.1 /100 | #183 | Average 5.5% |
| Malaysians | 41.8 /100 | #184 | Average 5.5% |
| Immigrants | Western Europe | 39.1 /100 | #185 | Fair 5.5% |
| Canadians | 38.2 /100 | #186 | Fair 5.5% |
| Immigrants | Western Asia | 38.2 /100 | #187 | Fair 5.5% |
| Immigrants | Norway | 36.1 /100 | #188 | Fair 5.5% |
| Immigrants | England | 35.7 /100 | #189 | Fair 5.5% |
| Immigrants | Kazakhstan | 33.9 /100 | #190 | Fair 5.5% |
| Irish | 31.3 /100 | #191 | Fair 5.5% |
| Moroccans | 31.2 /100 | #192 | Fair 5.5% |
| Immigrants | Africa | 31.0 /100 | #193 | Fair 5.5% |
| Slavs | 30.9 /100 | #194 | Fair 5.5% |
| Finns | 30.7 /100 | #195 | Fair 5.5% |
| Immigrants | South America | 29.8 /100 | #196 | Fair 5.5% |