Immigrants from South America vs Carpatho Rusyn Unemployment Among Ages 30 to 34 years
COMPARE
Immigrants from South America
Carpatho Rusyn
Unemployment Among Ages 30 to 34 years
Unemployment Among Ages 30 to 34 years Comparison
Immigrants from South America
Carpatho Rusyns
5.5%
UNEMPLOYMENT AMONG AGES 30 TO 34 YEARS
29.8/ 100
METRIC RATING
196th/ 347
METRIC RANK
5.3%
UNEMPLOYMENT AMONG AGES 30 TO 34 YEARS
77.3/ 100
METRIC RATING
132nd/ 347
METRIC RANK
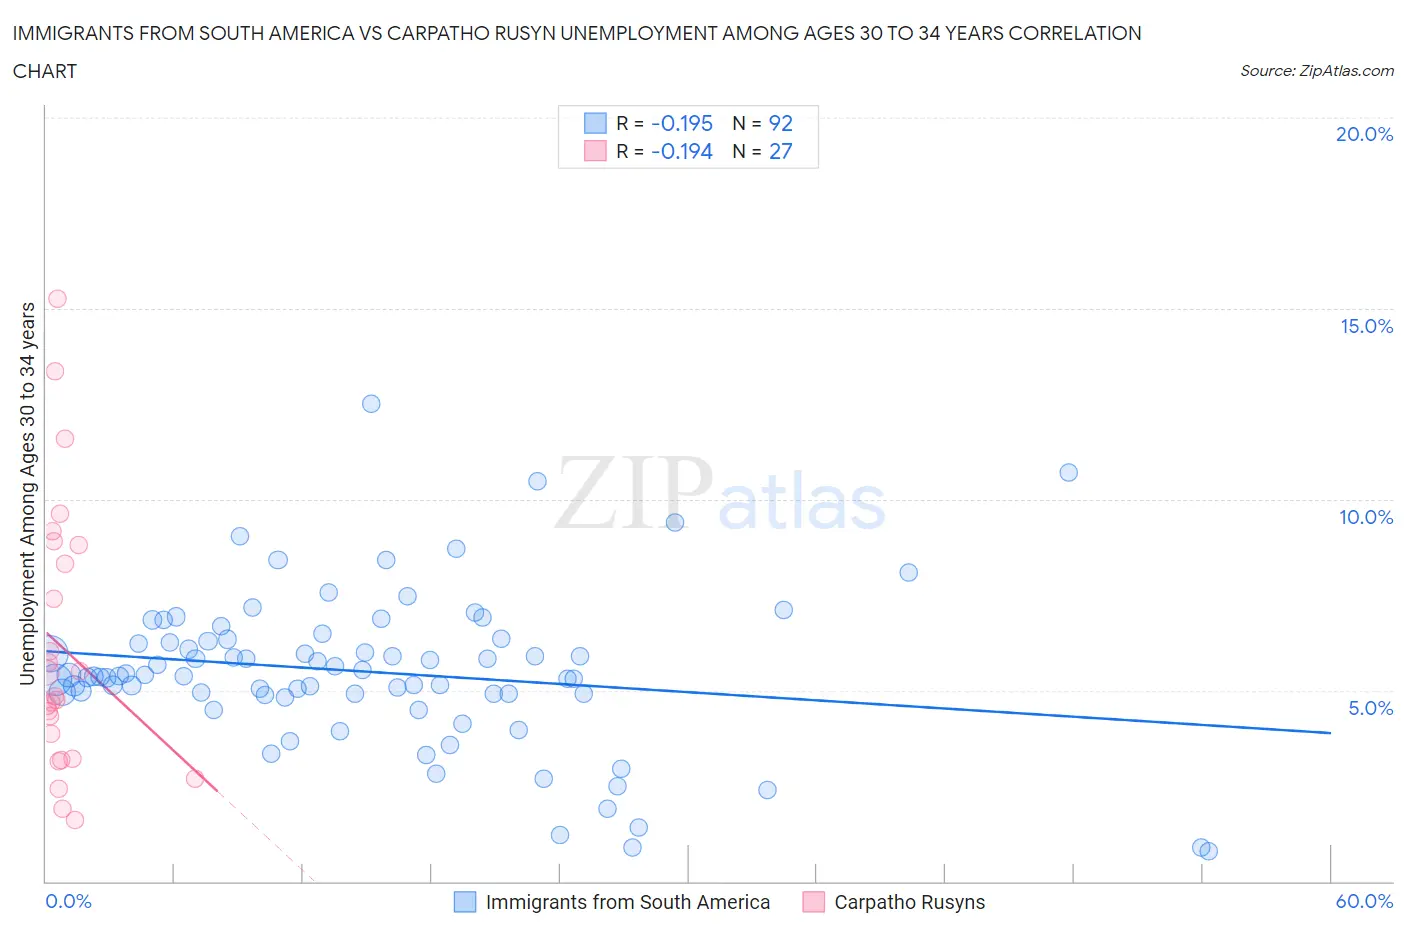
Immigrants from South America vs Carpatho Rusyn Unemployment Among Ages 30 to 34 years Correlation Chart
The statistical analysis conducted on geographies consisting of 448,094,916 people shows a poor negative correlation between the proportion of Immigrants from South America and unemployment rate among population between the ages 30 and 34 in the United States with a correlation coefficient (R) of -0.195 and weighted average of 5.5%. Similarly, the statistical analysis conducted on geographies consisting of 57,625,902 people shows a poor negative correlation between the proportion of Carpatho Rusyns and unemployment rate among population between the ages 30 and 34 in the United States with a correlation coefficient (R) of -0.194 and weighted average of 5.3%, a difference of 3.7%.
Unemployment Among Ages 30 to 34 years Correlation Summary
| Measurement | Immigrants from South America | Carpatho Rusyn |
| Minimum | 0.80% | 1.6% |
| Maximum | 12.5% | 15.2% |
| Range | 11.7% | 13.6% |
| Mean | 5.5% | 6.1% |
| Median | 5.4% | 4.8% |
| Interquartile 25% (IQ1) | 4.9% | 3.2% |
| Interquartile 75% (IQ3) | 6.3% | 8.8% |
| Interquartile Range (IQR) | 1.4% | 5.6% |
| Standard Deviation (Sample) | 2.0% | 3.5% |
| Standard Deviation (Population) | 2.0% | 3.4% |
Similar Demographics by Unemployment Among Ages 30 to 34 years
Demographics Similar to Immigrants from South America by Unemployment Among Ages 30 to 34 years
In terms of unemployment among ages 30 to 34 years, the demographic groups most similar to Immigrants from South America are Finnish (5.5%, a difference of 0.070%), Immigrants from Nicaragua (5.5%, a difference of 0.080%), Slavic (5.5%, a difference of 0.090%), Immigrants from Africa (5.5%, a difference of 0.10%), and Irish (5.5%, a difference of 0.12%).
| Demographics | Rating | Rank | Unemployment Among Ages 30 to 34 years |
| Immigrants | England | 35.7 /100 | #189 | Fair 5.5% |
| Immigrants | Kazakhstan | 33.9 /100 | #190 | Fair 5.5% |
| Irish | 31.3 /100 | #191 | Fair 5.5% |
| Moroccans | 31.2 /100 | #192 | Fair 5.5% |
| Immigrants | Africa | 31.0 /100 | #193 | Fair 5.5% |
| Slavs | 30.9 /100 | #194 | Fair 5.5% |
| Finns | 30.7 /100 | #195 | Fair 5.5% |
| Immigrants | South America | 29.8 /100 | #196 | Fair 5.5% |
| Immigrants | Nicaragua | 28.9 /100 | #197 | Fair 5.5% |
| Immigrants | Afghanistan | 27.2 /100 | #198 | Fair 5.6% |
| Nicaraguans | 26.6 /100 | #199 | Fair 5.6% |
| Immigrants | Southern Europe | 25.8 /100 | #200 | Fair 5.6% |
| South American Indians | 24.4 /100 | #201 | Fair 5.6% |
| Immigrants | Germany | 22.9 /100 | #202 | Fair 5.6% |
| Koreans | 20.7 /100 | #203 | Fair 5.6% |
Demographics Similar to Carpatho Rusyns by Unemployment Among Ages 30 to 34 years
In terms of unemployment among ages 30 to 34 years, the demographic groups most similar to Carpatho Rusyns are Immigrants from Northern Europe (5.3%, a difference of 0.0%), Immigrants from Eastern Europe (5.3%, a difference of 0.010%), German (5.3%, a difference of 0.050%), Bangladeshi (5.3%, a difference of 0.070%), and Polish (5.3%, a difference of 0.15%).
| Demographics | Rating | Rank | Unemployment Among Ages 30 to 34 years |
| Greeks | 80.4 /100 | #125 | Excellent 5.3% |
| Immigrants | Sri Lanka | 80.2 /100 | #126 | Excellent 5.3% |
| Taiwanese | 79.4 /100 | #127 | Good 5.3% |
| Immigrants | Uruguay | 79.3 /100 | #128 | Good 5.3% |
| Poles | 78.8 /100 | #129 | Good 5.3% |
| Germans | 77.8 /100 | #130 | Good 5.3% |
| Immigrants | Eastern Europe | 77.4 /100 | #131 | Good 5.3% |
| Carpatho Rusyns | 77.3 /100 | #132 | Good 5.3% |
| Immigrants | Northern Europe | 77.3 /100 | #133 | Good 5.3% |
| Bangladeshis | 76.6 /100 | #134 | Good 5.3% |
| Palestinians | 75.1 /100 | #135 | Good 5.4% |
| Pakistanis | 74.6 /100 | #136 | Good 5.4% |
| Immigrants | Canada | 74.6 /100 | #137 | Good 5.4% |
| Serbians | 72.9 /100 | #138 | Good 5.4% |
| Lithuanians | 72.4 /100 | #139 | Good 5.4% |