Immigrants from South Africa vs Immigrants from Cuba Unemployment Among Ages 45 to 54 years
COMPARE
Immigrants from South Africa
Immigrants from Cuba
Unemployment Among Ages 45 to 54 years
Unemployment Among Ages 45 to 54 years Comparison
Immigrants from South Africa
Immigrants from Cuba
4.4%
UNEMPLOYMENT AMONG AGES 45 TO 54 YEARS
92.5/ 100
METRIC RATING
107th/ 347
METRIC RANK
3.9%
UNEMPLOYMENT AMONG AGES 45 TO 54 YEARS
100.0/ 100
METRIC RATING
6th/ 347
METRIC RANK
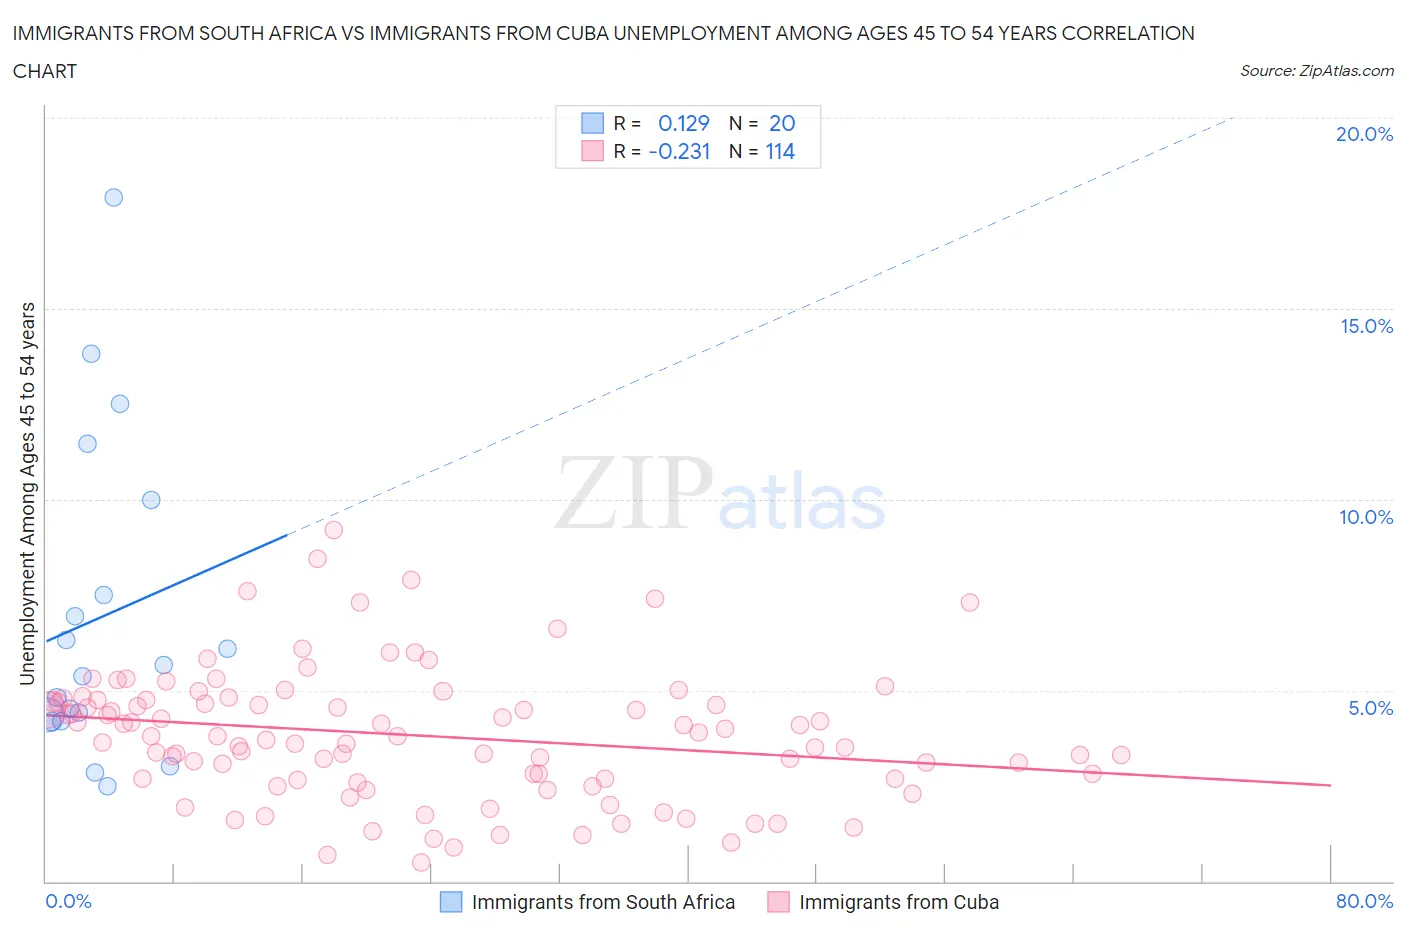
Immigrants from South Africa vs Immigrants from Cuba Unemployment Among Ages 45 to 54 years Correlation Chart
The statistical analysis conducted on geographies consisting of 229,312,992 people shows a poor positive correlation between the proportion of Immigrants from South Africa and unemployment rate among population between the ages 45 and 54 in the United States with a correlation coefficient (R) of 0.129 and weighted average of 4.4%. Similarly, the statistical analysis conducted on geographies consisting of 319,861,870 people shows a weak negative correlation between the proportion of Immigrants from Cuba and unemployment rate among population between the ages 45 and 54 in the United States with a correlation coefficient (R) of -0.231 and weighted average of 3.9%, a difference of 12.5%.
Unemployment Among Ages 45 to 54 years Correlation Summary
| Measurement | Immigrants from South Africa | Immigrants from Cuba |
| Minimum | 2.5% | 0.50% |
| Maximum | 17.9% | 9.2% |
| Range | 15.4% | 8.7% |
| Mean | 6.9% | 3.8% |
| Median | 5.5% | 3.8% |
| Interquartile 25% (IQ1) | 4.3% | 2.7% |
| Interquartile 75% (IQ3) | 8.7% | 4.7% |
| Interquartile Range (IQR) | 4.5% | 2.1% |
| Standard Deviation (Sample) | 4.1% | 1.7% |
| Standard Deviation (Population) | 4.0% | 1.7% |
Similar Demographics by Unemployment Among Ages 45 to 54 years
Demographics Similar to Immigrants from South Africa by Unemployment Among Ages 45 to 54 years
In terms of unemployment among ages 45 to 54 years, the demographic groups most similar to Immigrants from South Africa are Iranian (4.4%, a difference of 0.0%), Immigrants from Kenya (4.4%, a difference of 0.060%), Russian (4.4%, a difference of 0.060%), Immigrants from Sweden (4.4%, a difference of 0.090%), and New Zealander (4.4%, a difference of 0.090%).
| Demographics | Rating | Rank | Unemployment Among Ages 45 to 54 years |
| Immigrants | Eritrea | 94.7 /100 | #100 | Exceptional 4.4% |
| Immigrants | North America | 93.9 /100 | #101 | Exceptional 4.4% |
| Sri Lankans | 93.7 /100 | #102 | Exceptional 4.4% |
| Icelanders | 93.5 /100 | #103 | Exceptional 4.4% |
| Immigrants | Sweden | 93.0 /100 | #104 | Exceptional 4.4% |
| Immigrants | Kenya | 92.8 /100 | #105 | Exceptional 4.4% |
| Iranians | 92.5 /100 | #106 | Exceptional 4.4% |
| Immigrants | South Africa | 92.5 /100 | #107 | Exceptional 4.4% |
| Russians | 92.1 /100 | #108 | Exceptional 4.4% |
| New Zealanders | 91.9 /100 | #109 | Exceptional 4.4% |
| Immigrants | England | 91.3 /100 | #110 | Exceptional 4.4% |
| Immigrants | Nicaragua | 91.3 /100 | #111 | Exceptional 4.4% |
| Immigrants | Saudi Arabia | 91.1 /100 | #112 | Exceptional 4.4% |
| French Canadians | 91.0 /100 | #113 | Exceptional 4.4% |
| Immigrants | Chile | 90.9 /100 | #114 | Exceptional 4.4% |
Demographics Similar to Immigrants from Cuba by Unemployment Among Ages 45 to 54 years
In terms of unemployment among ages 45 to 54 years, the demographic groups most similar to Immigrants from Cuba are Danish (3.9%, a difference of 0.22%), Immigrants from India (3.9%, a difference of 0.39%), Immigrants from Venezuela (3.9%, a difference of 1.2%), Norwegian (3.9%, a difference of 1.3%), and Chinese (4.0%, a difference of 1.6%).
| Demographics | Rating | Rank | Unemployment Among Ages 45 to 54 years |
| Hmong | 100.0 /100 | #1 | Exceptional 3.7% |
| Fijians | 100.0 /100 | #2 | Exceptional 3.8% |
| Norwegians | 100.0 /100 | #3 | Exceptional 3.9% |
| Immigrants | India | 100.0 /100 | #4 | Exceptional 3.9% |
| Danes | 100.0 /100 | #5 | Exceptional 3.9% |
| Immigrants | Cuba | 100.0 /100 | #6 | Exceptional 3.9% |
| Immigrants | Venezuela | 100.0 /100 | #7 | Exceptional 3.9% |
| Chinese | 100.0 /100 | #8 | Exceptional 4.0% |
| Czechs | 100.0 /100 | #9 | Exceptional 4.0% |
| Venezuelans | 100.0 /100 | #10 | Exceptional 4.0% |
| Scandinavians | 100.0 /100 | #11 | Exceptional 4.0% |
| Swedes | 100.0 /100 | #12 | Exceptional 4.0% |
| Cubans | 100.0 /100 | #13 | Exceptional 4.0% |
| Immigrants | Bosnia and Herzegovina | 100.0 /100 | #14 | Exceptional 4.0% |
| Immigrants | Bolivia | 100.0 /100 | #15 | Exceptional 4.0% |