Carpatho Rusyn vs Immigrants from Cuba Unemployment Among Ages 45 to 54 years
COMPARE
Carpatho Rusyn
Immigrants from Cuba
Unemployment Among Ages 45 to 54 years
Unemployment Among Ages 45 to 54 years Comparison
Carpatho Rusyns
Immigrants from Cuba
4.1%
UNEMPLOYMENT AMONG AGES 45 TO 54 YEARS
100.0/ 100
METRIC RATING
24th/ 347
METRIC RANK
3.9%
UNEMPLOYMENT AMONG AGES 45 TO 54 YEARS
100.0/ 100
METRIC RATING
6th/ 347
METRIC RANK
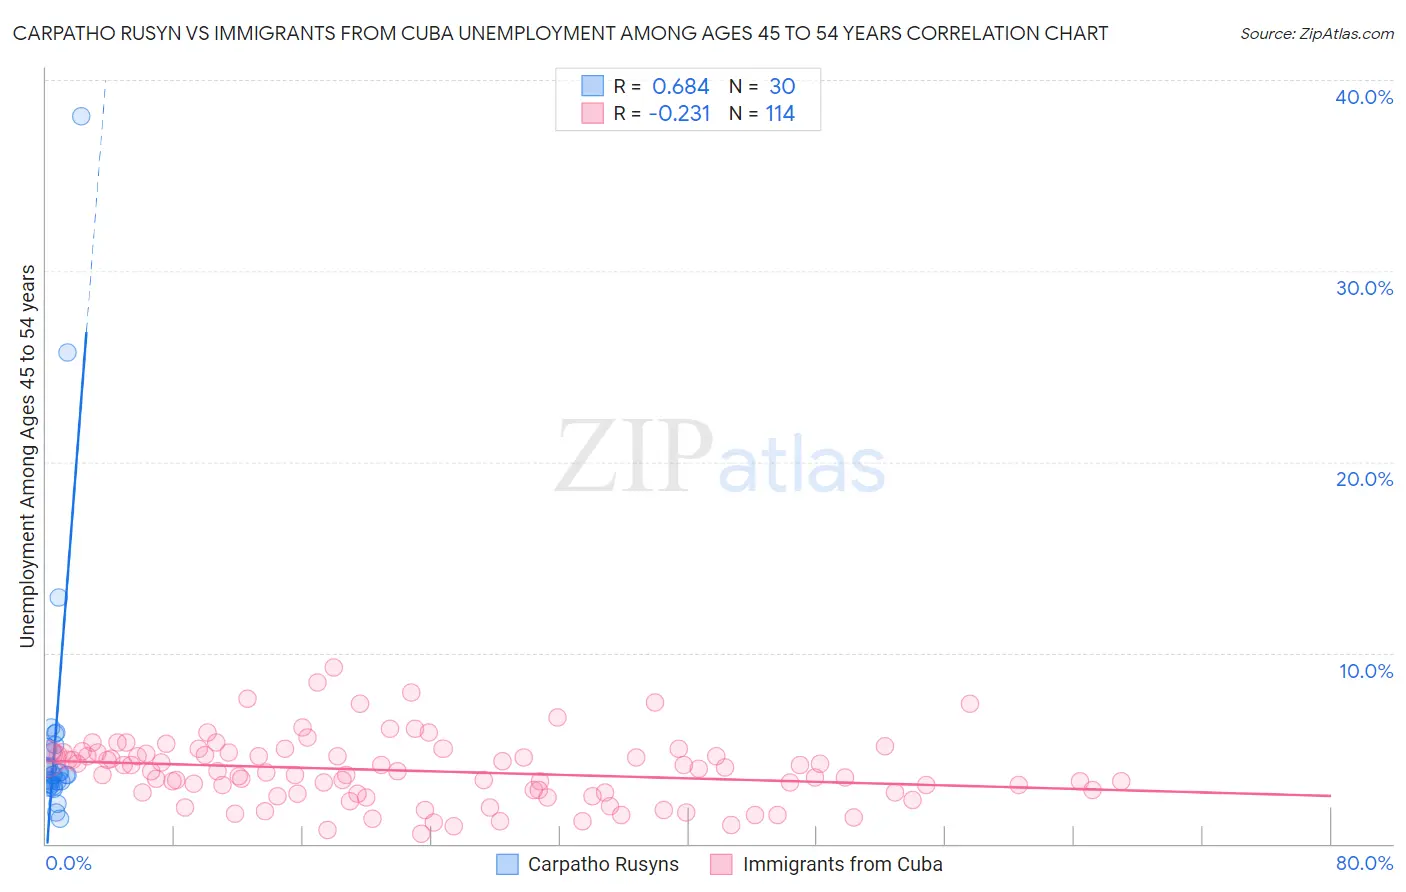
Carpatho Rusyn vs Immigrants from Cuba Unemployment Among Ages 45 to 54 years Correlation Chart
The statistical analysis conducted on geographies consisting of 58,336,549 people shows a significant positive correlation between the proportion of Carpatho Rusyns and unemployment rate among population between the ages 45 and 54 in the United States with a correlation coefficient (R) of 0.684 and weighted average of 4.1%. Similarly, the statistical analysis conducted on geographies consisting of 319,861,870 people shows a weak negative correlation between the proportion of Immigrants from Cuba and unemployment rate among population between the ages 45 and 54 in the United States with a correlation coefficient (R) of -0.231 and weighted average of 3.9%, a difference of 5.5%.
Unemployment Among Ages 45 to 54 years Correlation Summary
| Measurement | Carpatho Rusyn | Immigrants from Cuba |
| Minimum | 1.3% | 0.50% |
| Maximum | 38.1% | 9.2% |
| Range | 36.8% | 8.7% |
| Mean | 5.9% | 3.8% |
| Median | 3.6% | 3.8% |
| Interquartile 25% (IQ1) | 3.2% | 2.7% |
| Interquartile 75% (IQ3) | 5.0% | 4.7% |
| Interquartile Range (IQR) | 1.8% | 2.1% |
| Standard Deviation (Sample) | 7.5% | 1.7% |
| Standard Deviation (Population) | 7.4% | 1.7% |
Demographics Similar to Carpatho Rusyns and Immigrants from Cuba by Unemployment Among Ages 45 to 54 years
In terms of unemployment among ages 45 to 54 years, the demographic groups most similar to Carpatho Rusyns are Bolivian (4.1%, a difference of 0.12%), Bulgarian (4.1%, a difference of 0.65%), Yugoslavian (4.1%, a difference of 0.66%), European (4.1%, a difference of 0.74%), and English (4.1%, a difference of 1.1%). Similarly, the demographic groups most similar to Immigrants from Cuba are Danish (3.9%, a difference of 0.22%), Immigrants from Venezuela (3.9%, a difference of 1.2%), Chinese (4.0%, a difference of 1.6%), Czech (4.0%, a difference of 1.7%), and Venezuelan (4.0%, a difference of 2.4%).
| Demographics | Rating | Rank | Unemployment Among Ages 45 to 54 years |
| Danes | 100.0 /100 | #5 | Exceptional 3.9% |
| Immigrants | Cuba | 100.0 /100 | #6 | Exceptional 3.9% |
| Immigrants | Venezuela | 100.0 /100 | #7 | Exceptional 3.9% |
| Chinese | 100.0 /100 | #8 | Exceptional 4.0% |
| Czechs | 100.0 /100 | #9 | Exceptional 4.0% |
| Venezuelans | 100.0 /100 | #10 | Exceptional 4.0% |
| Scandinavians | 100.0 /100 | #11 | Exceptional 4.0% |
| Swedes | 100.0 /100 | #12 | Exceptional 4.0% |
| Cubans | 100.0 /100 | #13 | Exceptional 4.0% |
| Immigrants | Bosnia and Herzegovina | 100.0 /100 | #14 | Exceptional 4.0% |
| Immigrants | Bolivia | 100.0 /100 | #15 | Exceptional 4.0% |
| Thais | 100.0 /100 | #16 | Exceptional 4.0% |
| Tongans | 100.0 /100 | #17 | Exceptional 4.1% |
| Germans | 100.0 /100 | #18 | Exceptional 4.1% |
| Swiss | 100.0 /100 | #19 | Exceptional 4.1% |
| English | 100.0 /100 | #20 | Exceptional 4.1% |
| Europeans | 100.0 /100 | #21 | Exceptional 4.1% |
| Yugoslavians | 100.0 /100 | #22 | Exceptional 4.1% |
| Bulgarians | 100.0 /100 | #23 | Exceptional 4.1% |
| Carpatho Rusyns | 100.0 /100 | #24 | Exceptional 4.1% |
| Bolivians | 99.9 /100 | #25 | Exceptional 4.1% |