Immigrants from South Africa vs Immigrants from Canada Unemployment Among Ages 30 to 34 years
COMPARE
Immigrants from South Africa
Immigrants from Canada
Unemployment Among Ages 30 to 34 years
Unemployment Among Ages 30 to 34 years Comparison
Immigrants from South Africa
Immigrants from Canada
5.3%
UNEMPLOYMENT AMONG AGES 30 TO 34 YEARS
83.0/ 100
METRIC RATING
118th/ 347
METRIC RANK
5.4%
UNEMPLOYMENT AMONG AGES 30 TO 34 YEARS
74.6/ 100
METRIC RATING
137th/ 347
METRIC RANK
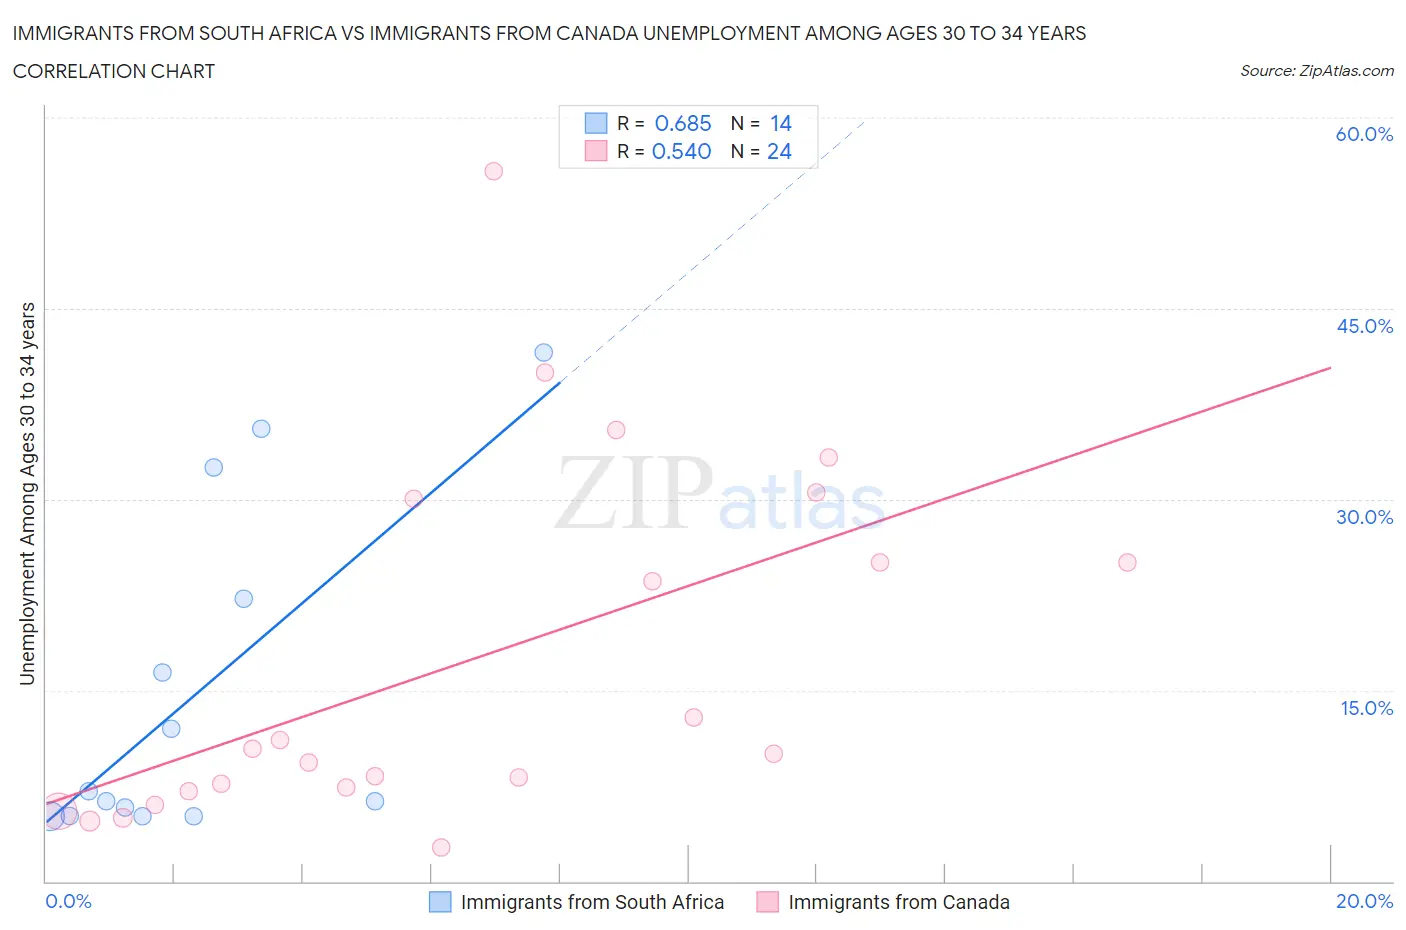
Immigrants from South Africa vs Immigrants from Canada Unemployment Among Ages 30 to 34 years Correlation Chart
The statistical analysis conducted on geographies consisting of 223,742,105 people shows a significant positive correlation between the proportion of Immigrants from South Africa and unemployment rate among population between the ages 30 and 34 in the United States with a correlation coefficient (R) of 0.685 and weighted average of 5.3%. Similarly, the statistical analysis conducted on geographies consisting of 422,416,239 people shows a substantial positive correlation between the proportion of Immigrants from Canada and unemployment rate among population between the ages 30 and 34 in the United States with a correlation coefficient (R) of 0.540 and weighted average of 5.4%, a difference of 0.91%.
Unemployment Among Ages 30 to 34 years Correlation Summary
| Measurement | Immigrants from South Africa | Immigrants from Canada |
| Minimum | 5.1% | 2.7% |
| Maximum | 41.6% | 55.8% |
| Range | 36.5% | 53.1% |
| Mean | 14.7% | 17.3% |
| Median | 6.7% | 10.2% |
| Interquartile 25% (IQ1) | 5.2% | 7.2% |
| Interquartile 75% (IQ3) | 22.2% | 27.5% |
| Interquartile Range (IQR) | 17.0% | 20.3% |
| Standard Deviation (Sample) | 13.0% | 14.1% |
| Standard Deviation (Population) | 12.5% | 13.8% |
Demographics Similar to Immigrants from South Africa and Immigrants from Canada by Unemployment Among Ages 30 to 34 years
In terms of unemployment among ages 30 to 34 years, the demographic groups most similar to Immigrants from South Africa are Australian (5.3%, a difference of 0.010%), New Zealander (5.3%, a difference of 0.060%), Immigrants from Poland (5.3%, a difference of 0.080%), Romanian (5.3%, a difference of 0.090%), and Immigrants from Netherlands (5.3%, a difference of 0.14%). Similarly, the demographic groups most similar to Immigrants from Canada are Pakistani (5.4%, a difference of 0.0%), Palestinian (5.4%, a difference of 0.050%), Bangladeshi (5.3%, a difference of 0.19%), Carpatho Rusyn (5.3%, a difference of 0.26%), and Immigrants from Northern Europe (5.3%, a difference of 0.26%).
| Demographics | Rating | Rank | Unemployment Among Ages 30 to 34 years |
| Australians | 83.1 /100 | #117 | Excellent 5.3% |
| Immigrants | South Africa | 83.0 /100 | #118 | Excellent 5.3% |
| New Zealanders | 82.5 /100 | #119 | Excellent 5.3% |
| Immigrants | Poland | 82.4 /100 | #120 | Excellent 5.3% |
| Romanians | 82.3 /100 | #121 | Excellent 5.3% |
| Immigrants | Netherlands | 81.8 /100 | #122 | Excellent 5.3% |
| Immigrants | Italy | 81.1 /100 | #123 | Excellent 5.3% |
| Immigrants | Brazil | 80.8 /100 | #124 | Excellent 5.3% |
| Greeks | 80.4 /100 | #125 | Excellent 5.3% |
| Immigrants | Sri Lanka | 80.2 /100 | #126 | Excellent 5.3% |
| Taiwanese | 79.4 /100 | #127 | Good 5.3% |
| Immigrants | Uruguay | 79.3 /100 | #128 | Good 5.3% |
| Poles | 78.8 /100 | #129 | Good 5.3% |
| Germans | 77.8 /100 | #130 | Good 5.3% |
| Immigrants | Eastern Europe | 77.4 /100 | #131 | Good 5.3% |
| Carpatho Rusyns | 77.3 /100 | #132 | Good 5.3% |
| Immigrants | Northern Europe | 77.3 /100 | #133 | Good 5.3% |
| Bangladeshis | 76.6 /100 | #134 | Good 5.3% |
| Palestinians | 75.1 /100 | #135 | Good 5.4% |
| Pakistanis | 74.6 /100 | #136 | Good 5.4% |
| Immigrants | Canada | 74.6 /100 | #137 | Good 5.4% |