Immigrants from Congo vs Immigrants from Canada Unemployment Among Ages 30 to 34 years
COMPARE
Immigrants from Congo
Immigrants from Canada
Unemployment Among Ages 30 to 34 years
Unemployment Among Ages 30 to 34 years Comparison
Immigrants from Congo
Immigrants from Canada
5.1%
UNEMPLOYMENT AMONG AGES 30 TO 34 YEARS
98.4/ 100
METRIC RATING
46th/ 347
METRIC RANK
5.4%
UNEMPLOYMENT AMONG AGES 30 TO 34 YEARS
74.6/ 100
METRIC RATING
137th/ 347
METRIC RANK
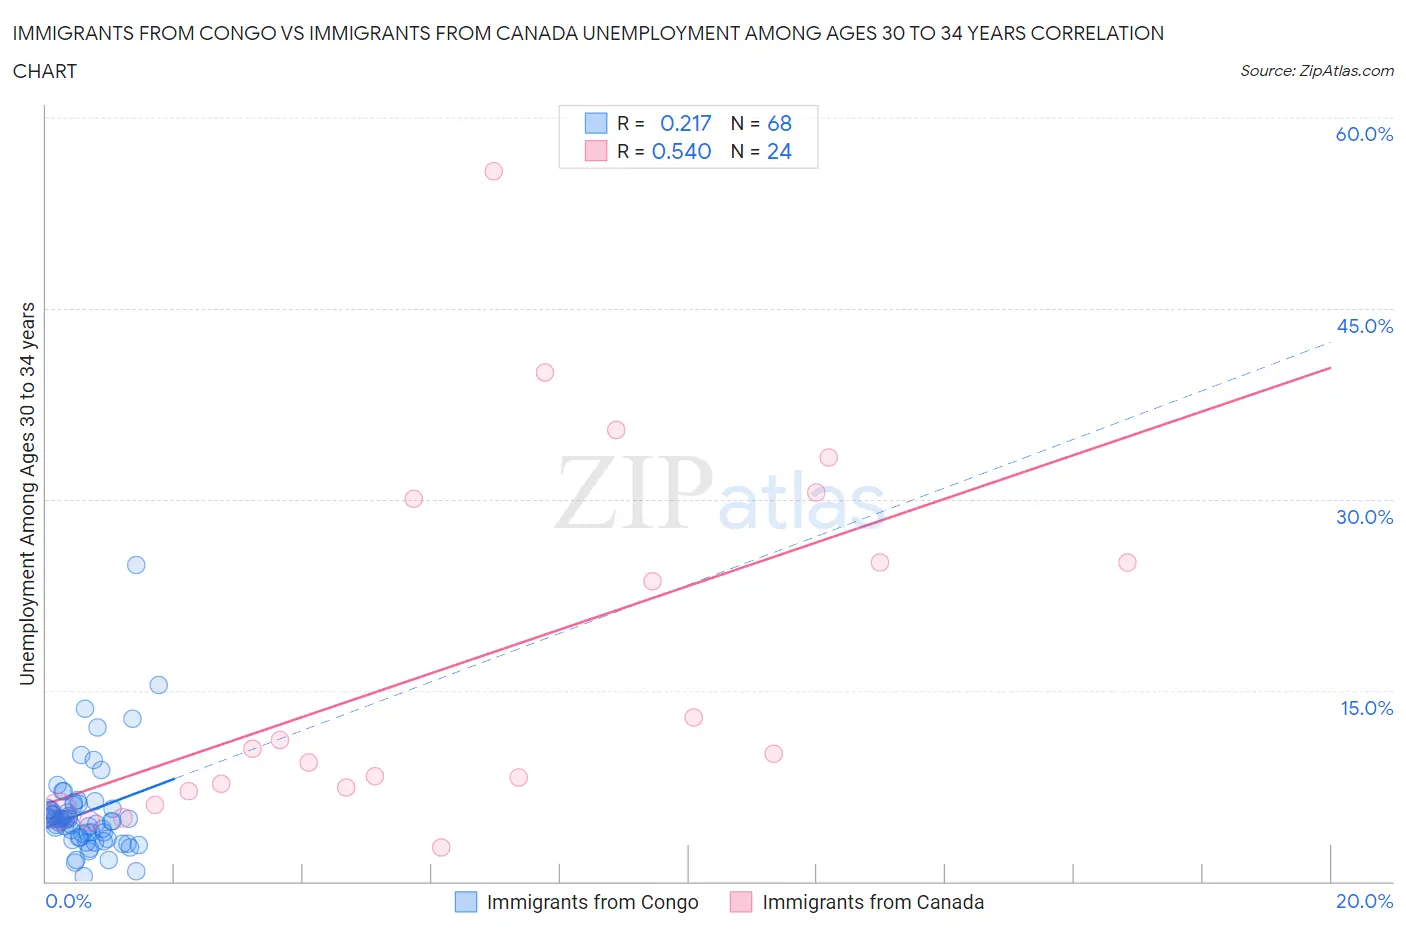
Immigrants from Congo vs Immigrants from Canada Unemployment Among Ages 30 to 34 years Correlation Chart
The statistical analysis conducted on geographies consisting of 91,108,629 people shows a weak positive correlation between the proportion of Immigrants from Congo and unemployment rate among population between the ages 30 and 34 in the United States with a correlation coefficient (R) of 0.217 and weighted average of 5.1%. Similarly, the statistical analysis conducted on geographies consisting of 422,416,239 people shows a substantial positive correlation between the proportion of Immigrants from Canada and unemployment rate among population between the ages 30 and 34 in the United States with a correlation coefficient (R) of 0.540 and weighted average of 5.4%, a difference of 5.7%.
Unemployment Among Ages 30 to 34 years Correlation Summary
| Measurement | Immigrants from Congo | Immigrants from Canada |
| Minimum | 0.40% | 2.7% |
| Maximum | 24.8% | 55.8% |
| Range | 24.4% | 53.1% |
| Mean | 5.4% | 17.3% |
| Median | 4.7% | 10.2% |
| Interquartile 25% (IQ1) | 3.4% | 7.2% |
| Interquartile 75% (IQ3) | 5.7% | 27.5% |
| Interquartile Range (IQR) | 2.3% | 20.3% |
| Standard Deviation (Sample) | 3.7% | 14.1% |
| Standard Deviation (Population) | 3.6% | 13.8% |
Similar Demographics by Unemployment Among Ages 30 to 34 years
Demographics Similar to Immigrants from Congo by Unemployment Among Ages 30 to 34 years
In terms of unemployment among ages 30 to 34 years, the demographic groups most similar to Immigrants from Congo are Cypriot (5.1%, a difference of 0.030%), Assyrian/Chaldean/Syriac (5.1%, a difference of 0.040%), Immigrants from Malaysia (5.1%, a difference of 0.17%), Puget Sound Salish (5.1%, a difference of 0.24%), and Turkish (5.1%, a difference of 0.27%).
| Demographics | Rating | Rank | Unemployment Among Ages 30 to 34 years |
| Fijians | 99.0 /100 | #39 | Exceptional 5.0% |
| Immigrants | Vietnam | 98.9 /100 | #40 | Exceptional 5.0% |
| Immigrants | Eastern Africa | 98.9 /100 | #41 | Exceptional 5.0% |
| Immigrants | Hong Kong | 98.8 /100 | #42 | Exceptional 5.0% |
| Soviet Union | 98.8 /100 | #43 | Exceptional 5.0% |
| Immigrants | Belgium | 98.7 /100 | #44 | Exceptional 5.1% |
| Yugoslavians | 98.6 /100 | #45 | Exceptional 5.1% |
| Immigrants | Congo | 98.4 /100 | #46 | Exceptional 5.1% |
| Cypriots | 98.4 /100 | #47 | Exceptional 5.1% |
| Assyrians/Chaldeans/Syriacs | 98.4 /100 | #48 | Exceptional 5.1% |
| Immigrants | Malaysia | 98.3 /100 | #49 | Exceptional 5.1% |
| Puget Sound Salish | 98.2 /100 | #50 | Exceptional 5.1% |
| Turks | 98.2 /100 | #51 | Exceptional 5.1% |
| Immigrants | Burma/Myanmar | 98.1 /100 | #52 | Exceptional 5.1% |
| Cubans | 98.1 /100 | #53 | Exceptional 5.1% |
Demographics Similar to Immigrants from Canada by Unemployment Among Ages 30 to 34 years
In terms of unemployment among ages 30 to 34 years, the demographic groups most similar to Immigrants from Canada are Pakistani (5.4%, a difference of 0.0%), Palestinian (5.4%, a difference of 0.050%), Serbian (5.4%, a difference of 0.15%), Bangladeshi (5.3%, a difference of 0.19%), and Lithuanian (5.4%, a difference of 0.20%).
| Demographics | Rating | Rank | Unemployment Among Ages 30 to 34 years |
| Germans | 77.8 /100 | #130 | Good 5.3% |
| Immigrants | Eastern Europe | 77.4 /100 | #131 | Good 5.3% |
| Carpatho Rusyns | 77.3 /100 | #132 | Good 5.3% |
| Immigrants | Northern Europe | 77.3 /100 | #133 | Good 5.3% |
| Bangladeshis | 76.6 /100 | #134 | Good 5.3% |
| Palestinians | 75.1 /100 | #135 | Good 5.4% |
| Pakistanis | 74.6 /100 | #136 | Good 5.4% |
| Immigrants | Canada | 74.6 /100 | #137 | Good 5.4% |
| Serbians | 72.9 /100 | #138 | Good 5.4% |
| Lithuanians | 72.4 /100 | #139 | Good 5.4% |
| Immigrants | North America | 72.2 /100 | #140 | Good 5.4% |
| Immigrants | Europe | 72.1 /100 | #141 | Good 5.4% |
| Immigrants | Greece | 72.0 /100 | #142 | Good 5.4% |
| Russians | 71.1 /100 | #143 | Good 5.4% |
| Immigrants | Russia | 71.0 /100 | #144 | Good 5.4% |